
AI workplace efficiency means output per unit of input — invoices per person-hour, tickets per day, days to close — and you can only prove it moved if you have a dated series for that ratio from before AI arrived. Hours saved is not that number. It is an estimate of a hypothetical.
Our position is narrower than the usual advice to "set a baseline first." Almost nobody did, and telling a team that already deployed to go back in time is useless. So borrow one. Every company already keeps meters it installed for reasons that have nothing to do with AI — the close pack, the ticket queue, the aging report, the overtime line — and those meters have three properties an AI dashboard never will: they pre-date the deployment, somebody outside the AI project owns them, and they carry a denominator. On Hacker News in July 2026, a developer posting as ModernMech put the problem plainly while describing his own contradictory numbers: efficiency and productivity are "meaningless weasel word unless they're qualified". He had written roughly ten times more code with AI and shipped a quarter as many releases. Two meters, opposite verdicts, one worker.
The short answer: You can only prove AI workplace efficiency moved by reading a metric your company was already keeping, for a different reason, before AI arrived — and if no such metric exists for the work in question, the honest report is "not measurable yet," not a figure for hours saved.
Last updated: July 30, 2026.
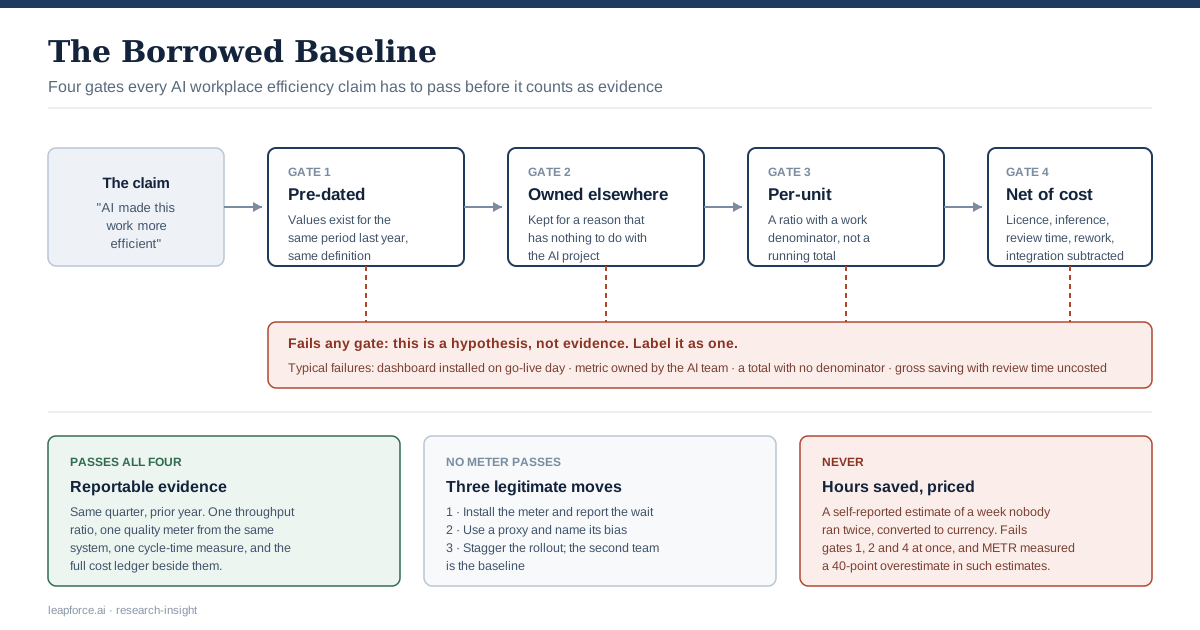
The Borrowed Baseline: four gates every AI efficiency claim has to pass before it counts as evidence.
We have not run this method inside a customer's finance system and published the result, and we are not going to pretend otherwise: the worked example below is constructed from stated assumptions, not from a client engagement. What follows is a measurement argument built on public research and on the arithmetic of the ledgers themselves.
What AI Workplace Efficiency Actually Measures
Efficiency is a ratio. The U.S. Bureau of Labor Statistics defines labor productivity as output per hour, "calculated by dividing an index of real output by an index of hours worked," in its Productivity and Costs release of June 4, 2026. Applied to a team rather than a national economy, AI workplace efficiency is the same shape: units of finished work divided by the resources consumed producing them. Invoices posted per person-hour. Tickets resolved per day. Candidates screened per recruiter-week. Days from order to cash.
The word "ratio" is doing all the work in that paragraph, and it is what most reporting on this subject quietly drops.
What it is not
Hours saved is not efficiency. It is a difference between what happened and what someone believes would have happened. The counterfactual has no observation behind it. Nobody ran the week twice.
Volume is not efficiency. More output with more input is growth, not efficiency. More output with the same input is efficiency. This is why every credible metric needs a denominator, and why "we generated 40% more drafts" tells you nothing until you know what it cost to generate and to check them.
Tool usage is not efficiency. Seats activated, prompts sent, tokens consumed, and suggestion-acceptance rates all measure adoption. They are inputs on the wrong side of the fraction. A team can double its token spend and get slower.
Sentiment is not efficiency. "The team loves it" is a real and useful signal about retention and morale. It is not a productivity measurement, and treating it as one is how organisations end up defending a spend they cannot describe.
That leaves a narrow definition, deliberately. AI workplace efficiency is a ratio of finished work to resources consumed, tracked on the same meter before and after AI entered the process. Everything in this article follows from insisting on the second half of that sentence.
The Belief Gap: Everyone Reports Gains, No Meter Shows Them
The gap between what workers report about AI and what instruments record is now large, repeatedly measured, and pointed in a consistent direction. In the 2025 DORA research, announced by Google Cloud, "90% of survey respondents report using AI at work. More than 80% believe it has increased their productivity," across responses from nearly 5,000 technology professionals. Belief is close to unanimous. The instrumented picture is not, and every serious efficiency claim has to survive that discrepancy before it survives anything else.
The sharpest single measurement of the gap comes from METR. In a randomised controlled trial of 16 experienced open-source developers across 246 real issues, published July 10, 2025, developers allowed to use AI tools "take 19% longer to complete issues, a significant slowdown." The belief data from the same participants is the part worth pinning to a wall: "developers expected AI to speed them up by 24%, and even after experiencing the slowdown, they still believed AI had sped them up by 20%." METR later quantified the calibration error directly. In its May 2026 survey of 349 technical workers, it notes that its prior study "found that people overestimated AI's effect on their time spent on tasks by 40 percentage points on average."
Forty points. That is the size of the error in the number most companies are currently reporting to their boards.
The macro meters agree with the micro ones
Zoom out to the national accounts and the same pattern holds. Nonfarm business labor productivity grew 0.3 percent in the first quarter of 2026 and 2.8 percent from the same quarter a year earlier, per the BLS release of June 4, 2026. Over the current business cycle, from the fourth quarter of 2019 through the first quarter of 2026, BLS records annualised productivity growth of 2.1 percent, which it describes as "higher than the 1.5-percent rate of the previous business cycle" and "the same as the long-term rate of 2.1 percent since the first quarter of 1947."
Read that carefully, because both halves matter. Productivity growth is running above the sluggish 2007–2019 stretch. It is also running exactly at the average of the last eight decades. Whatever AI is doing, it has not yet produced a visible break in the trend of the most-watched efficiency meter in the world.
The two best natural experiments say the same thing at the level of workers and firms. Alexander Bick, Adam Blandin and David Deming, in The Rapid Adoption of Generative AI (NBER working paper 32966), found that "between 1 and 5 percent of all work hours are currently assisted by generative AI, and respondents report time savings equivalent to 1.4 percent of total work hours." Note the construction: respondents report. Even the self-reported saving, aggregated honestly across a nationally representative sample, is small.
And when researchers went looking for the saving in administrative records rather than surveys, it was not there. Anders Humlum and Emilie Vestergaard, using Danish labour-market records in Still Waters, Rapid Currents (NBER working paper 33777), report that most employers in exposed occupations have adopted chatbot initiatives and workers report productivity benefits — and yet, using a difference-in-differences design, they estimate "precise null effects on earnings and recorded hours," ruling out effects larger than 2% two years after the launch of ChatGPT.
| Measurement | Source | What it found | Instrument type |
|---|---|---|---|
| Belief in own productivity gain | DORA 2025, ~5,000 respondents | over 80% believe AI increased their productivity | Self-report |
| Self-reported time saved | Bick, Blandin & Deming, NBER w32966 | savings equal to 1.4% of total work hours | Self-report, nationally representative |
| Self-reported value change | METR survey, 349 technical workers, Feb–Apr 2026 | median 1.4–2x change in value of work | Self-report |
| Calibration error of self-report | METR, prior RCT | overestimated AI's time effect by 40 percentage points | Measured against timed tasks |
| Timed task completion | METR RCT, 16 devs, 246 issues | 19% longer with AI allowed | Randomised, instrumented |
| Earnings and recorded hours | Humlum & Vestergaard, NBER w33777 | precise nulls, effects larger than 2% ruled out | Administrative records |
| Aggregate output per hour | BLS, Q1 2026 revised | 2.1% annualised this cycle, equal to the 1947-onward average | National accounts |
Read the right-hand column top to bottom. The effect size shrinks as the instrument gets harder to fool. That is the single most useful fact in this entire subject, and it is the reason measuring AI productivity with a survey is not measurement at all.
One caveat that cuts the other way, and why it matters
Honest treatment of the METR trial requires reporting what METR itself has since said about it. In a February 2026 update, the organisation reported that it is changing its experiment design, and disclosed severe selection problems in the follow-up round: between "30% to 50%" of developers avoided submitting tasks because they did not want to do the work without AI, and "an increased share of developers say they would not want to do 50% of their work without AI." Its late-2025 estimates were −18% for returning developers (confidence interval −38% to +9%) and −4% for newly recruited ones (−15% to +9%). Those intervals are wide enough to include zero and modest speedups. METR's own conclusion is that the data now gives an "unreliable signal of the current productivity effect," and that selection effects likely make its estimate "a lower-bound on the true productivity effects."
We flag this because it is exactly the discipline this article is arguing for. The strongest available measurement of AI's effect on skilled work has been publicly downgraded by the people who ran it. Anyone quoting "19% slower" in 2026 without that footnote is doing the thing they accuse the vendors of.
The same currency check overturns a second widely repeated claim. DORA's 2024 report stated that AI adoption "negatively impacts software delivery stability and throughput" (DORA 2024). By 2025 the throughput half had reversed: DORA now reports "a positive relationship between AI adoption on both software delivery throughput and product performance," while "AI adoption does continue to have a negative relationship with software delivery stability." One vendor-neutral research programme, two editions, opposite signs on the same variable. If you are citing a 2024 finding about AI and efficiency, check whether the 2025 edition still says it.
Where the Saved Time Actually Goes
Suppose the time saving is real at the level of the individual task. The reason it fails to appear in any company metric is not that it was imaginary. It is that saved time has four possible destinations, and only two of them are visible in a ledger.
Destination 1: it is absorbed into the same role. The work expands to fill the hours. A recruiter who screens résumés faster writes longer feedback notes. An analyst who builds the model faster builds three variants. Nothing changes in headcount, output volume, or cycle time. This destination is invisible by construction, and it is almost certainly the most common one. It can still be worth having — absorbed time is where reduced burnout and better-quality work live — but it is not efficiency and it cannot be booked as one.
Destination 2: it is reabsorbed as more volume at the same cost. Output per person rises. This is efficiency and it is visible: in units per FTE, in cost per unit, in avoided hires. It is the destination worth engineering for, and it is the one that workflow automation reaches most reliably, because automating a step removes the hours rather than freeing them.
Destination 3: it converts to cycle time. The work is not larger, it finishes sooner. Days to close, days to pay, time to first response, lead time to production. Visible on any meter that carries a timestamp, and often the fastest measurable win.
Destination 4: it converts to verification and oversight. The time comes back on the other side of the process, checking output. DORA's 2025 framing of the throughput-plus-instability finding is that acceleration exposes weaknesses downstream: without strong automated testing, mature version control and fast feedback, higher change volume produces instability. Humlum and Vestergaard find the same thing in Danish administrative data, describing employers absorbing AI "through task reorganization — including new tasks in content generation, AI oversight, and AI integration."
| Destination | Shows up in a company metric? | Which meter sees it | Typical share of the saving |
|---|---|---|---|
| Absorbed into the same role | No | none | Largest, and unmeasurable |
| Reabsorbed as volume | Yes | units per FTE, cost per unit, avoided hires | The one worth targeting |
| Converted to cycle time | Yes | days-to-X, lead time, time-to-first-response | Fastest to detect |
| Converted to verification | Yes, as a cost | review hours, rework rate, incident rate | Systematically under-counted |
ModernMech's Hacker News comment is destination four in miniature: ten times the code, a quarter of the releases. In the same comment he names the accounting failure that follows: people "eagerly count immediate productivity gains and discount long-term productivity sinks."
The practical consequence is a rule you can apply in a planning meeting. Before you deploy, decide which destination you are aiming at, because that decision picks your meter. If you want volume, the meter is units per FTE. If you want cycle time, the meter is a timestamp difference. If you cannot name a destination, you have not designed an efficiency project; you have bought a tool. Our earlier analysis on where AI process optimization actually lands covers the companion question of which step to aim at; this article is about proving the aim was true.
The Borrowed Baseline: Four Tests for a Meter You Can Trust
Here is the method, named so it travels: the Borrowed Baseline. Do not build an AI measurement programme. Borrow a measurement your company already runs for a reason that has nothing to do with AI, and read the AI effect off it. A borrowed meter is credible for four structural reasons, and each one is a test you can apply in about ninety seconds.
Test 1: Pre-dated
The series must have values from before your AI deployment, ideally twelve months or more, so seasonality is visible. A dashboard that starts on go-live day cannot produce a before-and-after, no matter how good it looks. This test alone eliminates most AI analytics products, because they begin collecting when you install them.
Practical check: can I pull this number for the same month last year, without asking anyone to reconstruct it?
One audit-grade refinement, because internal audit will ask it: confirm the metric's definition and collection method did not change inside the comparison window. A support team that switched helpdesk platforms, or a finance team that changed what counts as a posted invoice, has broken the series without anyone noticing. If the definition moved, the series is not pre-dated in the sense that matters.
Test 2: Owned somewhere else
The meter's owner must be someone with no stake in the AI programme's success: the controller, the service-desk manager, the head of quality. Their motive for keeping the number accurate predates you and survives you. A metric owned by the team that bought the tool is not evidence; it is advocacy with decimal places.
Practical check: if the AI project were cancelled tomorrow, would this number still be produced next month?
In a company small enough that one person owns every number, this test still works, because it is about the meter's purpose, not the org chart. The question is whether the metric would exist if AI had never arrived. A days-to-pay figure kept for cash management passes. A tab created to justify the subscription does not.
Test 3: Per-unit
The number must be a ratio with a denominator that describes work, not a total. Total tickets closed rises when volume rises. Tickets closed per agent-hour does not. This is the test that separates efficiency from activity, and it is the one most internal reporting fails.
Practical check: if we hired two people tomorrow, would this number improve for the wrong reason?
Test 4: Net of cost
The measurement must subtract everything AI added: licences, inference, review time, rework, incidents, integration, and the cost of the measurement itself. A gross saving is a marketing number. See the cost-side section below for the full ledger.
Practical check: have I costed the review step, or did I assume checking is free?
A claim that passes all four is evidence. A claim that fails any one of them is a hypothesis, and should be labelled as one when it goes upward. That labelling is not modesty; it is what stops a finance team discovering the weakness six months later and discounting everything else you have told them.
The most useful property of the Borrowed Baseline is that it also tells you when to stop. If no existing meter for a piece of work passes all four tests, the honest conclusion is that AI workplace efficiency is not currently measurable for that work. Saying so is a stronger position than producing a number you cannot defend.
The Meter Catalogue: What Each Function Already Counts
Most of the writing on AI efficiency metrics is about software engineering, because engineering is the one function that already had a measurement culture. That leaves the majority of an organisation unserved. The table below lists meters that commonly pass all four tests, function by function, along with their usual owner and how far back the series typically runs. Treat it as a starting inventory to check against your own systems, not a claim about your specific stack.
| Function | Borrowed meter | Usual owner | Typical history | Destination it detects |
|---|---|---|---|---|
| Accounts payable | Invoices posted per AP FTE per month; days-to-pay | Controller | Years, in the close pack | Volume, cycle time |
| Financial close | Days to close the month; number of post-close adjustments | Controller | Years | Cycle time, quality |
| Customer support | Tickets resolved per agent-hour; first-contact resolution rate; reopen rate | Support operations | Years, in the helpdesk | Volume, quality |
| Recruiting | Time-to-fill by requisition; screens per recruiter-week; offer-accept rate | Talent operations | Years, in the ATS | Cycle time, volume |
| Sales operations | Days in each pipeline stage; quotes issued per rep-week; quote error rate | Revenue operations | Years, in the CRM | Cycle time, quality |
| Legal and contracting | Days from request to signature; contracts reviewed per lawyer-month; deviation rate | General counsel | Often years, in the CLM | Cycle time, volume |
| IT service desk | Mean time to resolve by category; tickets per technician-shift; repeat-contact rate | Service management | Years, in ITSM | Cycle time, volume |
| Software delivery | Lead time for changes; change failure rate; time to restore | Engineering leadership | Years, if DORA metrics were already kept | Cycle time, verification cost |
| Warehouse and fulfilment | Lines picked per labour-hour; order accuracy rate | Operations | Years, in the WMS | Volume, quality |
| Payroll and HR admin | Payroll exceptions per cycle; ticket volume per employee served | HR operations | Years | Volume, quality |
Three notes on using it.
First, always pair a throughput meter with a quality meter from the same system. Tickets per agent-hour without reopen rate is how a team gets rewarded for closing tickets badly. Support reopens, post-close adjustments, contract deviations, change failure rate, order accuracy — these are the meters that catch efficiency bought by lowering the standard, and they are usually already sitting next to the throughput number in the same report.
Second, compare like periods. Quarter-over-same-quarter-last-year beats quarter-over-previous-quarter for anything with a seasonal shape, which is nearly everything in finance, retail and recruiting. This is precisely what the twelve-month pre-dated series buys you.
Third, the absence of a row is informative. Knowledge work with no unit of output — strategy, design exploration, research, most management — has no meter that passes test three, because it has no countable unit. That is not a gap in this table. It is a real property of the work, and it means efficiency claims about those functions will stay unproven for the foreseeable future. Say that out loud rather than inventing a proxy.
Five Grades of Evidence for an AI Efficiency Claim
Not every claim needs a randomised trial. It does need a label. The ladder below grades AI efficiency evidence by what it can survive, and the practical use of it is to attach the grade to the number every time you report it.
| Grade | What it is | What it survives | What it costs you to produce |
|---|---|---|---|
| 1 | Anecdote: "this took me twenty minutes instead of two hours" | A hallway conversation | Nothing |
| 2 | Aggregated self-report: survey of hours saved | A slide, until someone asks how it was collected | A survey, and a 40-point calibration risk |
| 3 | Tool telemetry: seats, prompts, tokens, acceptance rate | Adoption questions only; fails test three | Included with the tool |
| 4 | Borrowed baseline before-and-after, netted, same-period comparison | Finance review, audit, a board question | A day of work with the metric owner |
| 5 | Staggered or randomised rollout across comparable teams | External scrutiny and publication | A quarter, and organisational patience |
Grade 2 deserves its bad reputation but not exile. Self-report is the only instrument that can tell you where people feel the friction, which is how you choose what to instrument next. Its failure mode is specific: it cannot size an effect. Use it to select, never to quantify.
Grade 3 is the most dangerous rung, because it produces the largest, cleanest, most dashboard-ready numbers in the entire stack, and they measure consumption. Seat utilisation, prompt counts and acceptance rates are vanity metrics in the precise sense: they rise when you spend more and fall when you spend less, and neither direction tells you anything about finished work. A practitioner on Hacker News, posting as unknownfuture in July 2026, described what this looks like across several large employers: they have "forgotten the last 50 years of lessons" in measuring developer productivity and hyperfocused on pull-request throughput and token usage. Token usage is a cost. Reporting it as a benefit is a sign-error.
Grade 5 is where the strongest public findings come from, and it is worth knowing that it is achievable inside a company. The staggered-rollout design is exactly what produced the best-known positive result in this literature: Erik Brynjolfsson, Danielle Li and Lindsey Raymond, in Generative AI at Work (NBER working paper 31161), used the staggered introduction of an AI assistant across 5,179 customer-support agents and measured a 14% average increase in issues resolved per hour, concentrated among novice and lower-skilled workers, with minimal effect on the most experienced. Note the shape of that finding: it is a per-hour ratio, it came from an instrument the company already ran, and the average conceals a distribution in which some workers gained nothing.
If you roll out to one region this quarter and the next region next quarter, you have grade 5 for free. Sequencing a deployment by team is usually operationally sensible anyway. Doing it deliberately, and holding the comparison, converts a rollout schedule into an experiment at no extra cost. That is the single highest-return decision available in measuring AI productivity, and it has to be made before go-live, which is why it belongs in the deployment plan rather than the analytics backlog.
Efficiency Is Net or It Is Nothing
Test four is where most claims die, so it gets its own ledger. Everything below is a real cost of running AI in a business process, and most reporting includes only the first line.
| Cost line | How to size it | Commonly missed because |
|---|---|---|
| Licences and seats | Invoice | It isn't — this is the one line everyone counts |
| Inference and model spend | Gateway or provider billing, per team | Charged centrally, so it never lands on the process owner's budget |
| Human review of AI output | Seconds per item times volume times loaded rate | Assumed to be free, or folded into "the work" |
| Rework from wrong output | Error rate times correction time | Attributed to the person who accepted the output |
| Incident and instability cost | Change failure rate, reopen rate, escalations | Lands in a different quarter than the saving |
| Integration and engineering | One-off hours, amortised | Treated as capex and excluded from the operating comparison |
| Training and change management | Hours per person, plus onboarding time for new starters, plus the productivity dip | Nobody wants to admit the dip |
| Governance and audit | Access reviews, evidence gathering, policy exceptions | Only appears when a regulator or customer asks |
| The measurement itself | Analyst time on the borrowed meters | Ironically, never budgeted |
Two of these deserve expansion because they routinely reverse a verdict.
Human review is the dominant hidden cost in high-volume processes. Twenty seconds of extra checking on four thousand items a month is twenty-two hours, most of a full working week, recurring, forever. If the AI step saves ninety seconds per item and adds twenty seconds of verification, the net is still strongly positive. If it saves thirty seconds and adds twenty, it is marginal, and the arithmetic decides the project rather than the demo. This cost also declines with practice, which is why a ninety-day read and a twelve-month read can point in opposite directions, and why you should record the review-time assumption explicitly instead of burying it.
Model spend belongs to the process, not to IT. When inference is billed centrally, the efficiency numerator sits with the operations team and the denominator sits with the platform team, and no single report contains both. This is a bookkeeping problem with a bookkeeping fix: attribute AI spend to the team, tool, and agent that generated it, so cost per unit of work is computable in one place. It is the reason per-agent cost attribution shows up as a governance requirement later in this article rather than as a nice-to-have.
The size of the cost side is not hypothetical. The Hacker News commenter sensanaty described a formal two-year evaluation at a profitable public company with roughly 2,000 developers, measuring merge times, delivery, rollback incidence and review-bot interaction across the estate. Their reported result was a 7% overall productivity increase, with the best teams near 20% and some teams negative — set against a tooling budget the commenter puts at 2,000 EUR per developer per month. We cannot independently verify a single anonymous account of an internal document, and we are not treating it as a data point about industry averages. We cite it because the structure of the reasoning is exactly right: a per-team distribution rather than an average, quality meters alongside throughput meters, and the cost side placed next to the benefit. That is what a grade-4 claim looks like when a practitioner builds one.
For the fuller treatment of what the denominator contains beyond the licence, see our earlier analysis of enterprise AI implementation cost beyond the license, and, for the specific failure of pilots that never costed a unit of work at full volume, why AI pilots stall.
A Worked Example, End to End
The following is an illustrative worked example built from stated assumptions. It is not a client, not a case study, and no part of it is a measurement we took. Its purpose is to show the arithmetic reconciling, including the part where it reconciles to an unwelcome answer.
Setting. A 400-person manufacturer. Accounts payable, three FTE. Invoices arrive as PDFs and scans; a clerk codes each one and posts it. In April 2026 the company deploys AI extraction and coding suggestions; a human still approves every posting.
Meters borrowed. Invoices posted per AP FTE per month, from the monthly close pack, kept since 2021 by the controller. Average days-to-pay, from the ERP aging report, same owner. AP overtime hours, from payroll. All three pass the four tests: pre-dated by years, owned by finance and payroll rather than by the AI project, expressed per unit or per period, and pairable with a quality meter (post-close adjustments).
Comparison window. April–June 2026 against April–June 2025. Same quarter, prior year, because invoice volume and overtime in this business have a seasonal shape.
| Measure | Apr–Jun 2025 | Apr–Jun 2026 | Change |
|---|---|---|---|
| Invoices posted per month | 4,200 | 4,500 | +7.1% volume |
| AP FTE | 3.0 | 3.0 | none |
| Invoices per FTE per month | 1,400 | 1,500 | +7.1% |
| Average days-to-pay | 27 | 24 | −3 days |
| AP overtime hours per month | 46 | 18 | −28 hours |
| Post-close AP adjustments per month | 9 | 8 | −1 |
The throughput and cycle-time gains are real and the quality meter did not deteriorate, which is the first thing to check. Now the money, at a fully loaded AP rate of $52 per hour, or $8,320 per month per FTE at 160 hours.
Expressed the way BLS expresses it, the unit labour cost of a posted invoice fell from about $5.94 to $5.55, a drop of roughly 7%, the same 7% seen in the per-FTE ratio, which is a useful arithmetic check that the two meters agree.
Benefit side. To post 4,500 invoices at the 2025 rate of 1,400 per FTE would have required 3.21 FTE. The company used 3.0. Avoided labour: 0.21 FTE, or about $1,750 per month. Overtime recovered: 28 hours at $52, or $1,456 per month. Total measured benefit: $3,206 per month.
Cost side.
| Line | Calculation | Monthly |
|---|---|---|
| Software licence | Contract | $1,900 |
| Inference through the gateway | Metered, attributed to AP | $340 |
| Added human verification | 4,500 items × 20 seconds = 25 hours × $52 | $1,300 |
| Rework on mis-coded invoices | 1.8% of 4,500 = 81 items × 6 minutes = 8.1 hours × $52 | $421 |
| Integration, amortised | 90 hours × $52 = $4,680 over 12 months | $390 |
| Total | $4,351 |
Net: minus $1,145 per month at the ninety-day mark.
That is the honest answer, and reporting it is the point of the example. A grade-2 version of this same deployment would have shown "28 hours of overtime eliminated and three days off days-to-pay" and been received as a success. The grade-4 version says the project is currently costing $1,145 a month, and then — because it is built on a ratio — it can say precisely what would change that.
The decision that would have made this read cheaper was available at go-live and costs nothing: deploy to one of two comparable AP teams first. The other team is then the control, and the volume growth, the hiring freeze and the seasonality apply to both. Nobody does this because rollout schedules are treated as logistics rather than as evidence.
The crossover condition. The benefit is dominated by avoided hiring, which scales with volume while most of the cost does not. At 5,200 invoices per month with the same three FTE, 3.71 FTE would have been needed at the old rate: 0.71 FTE avoided, or $5,940, plus the same $1,456 of overtime, for $7,396 of benefit. Costs rise to roughly $4,675 as inference, verification and rework scale with volume. Net: plus $2,721 per month.
So the finding is not "AI did not work in accounts payable." The finding is: holding the overtime saving constant, this deployment breaks even near 4,700 invoices a month and pays above it, sooner if verification time falls with practice or the licence is renegotiated — and at today's volume of 4,500 it does not. That sentence is defensible in front of a controller, it is actionable, and no self-reported hours-saved figure could have produced it.
Note also what the example did not require: no new dashboard, no analytics platform, no instrumentation project. Three numbers the controller already publishes, one prior-year comparison, and an hour of arithmetic.
What to Do When No Meter Exists
Sometimes the catalogue comes up empty. The work has no countable unit, or the system that would hold the history was replaced last year, or the process is new. Efficiency is still a real question in those cases; it is just not yet an answerable one on the evidence you hold. There are exactly three legitimate moves, and one illegitimate one.
Move 1: install the meter and wait. Define the unit, start counting, and accept that your first credible before-and-after is a quarter or two away. Report the delay as a finding rather than filling the gap. This is the right move when the process will still exist in a year.
Move 2: use a proxy and name its bias in the same sentence. If you cannot count units of finished work, count something adjacent and be explicit about which direction the error runs. "Draft-to-approval cycle time fell 20%, which understates any quality change because we do not measure post-approval revisions" is a usable sentence. "Efficiency improved 20%" is not. A named bias is a credible claim; an unnamed proxy is a liability.
Move 3: stagger the rollout and make the comparison the measurement. Where two comparable teams do the same work, give one the tool this quarter and the other next quarter. You do not need a pre-AI history at all, because the control team is the baseline. This is grade 5 evidence obtained by scheduling, and it is the most under-used option in the list.
The illegitimate move is converting a self-reported hours-saved estimate into a currency figure and reporting it as savings. It fails three of the four tests at once — no pre-dated series, owned by the project, and grossed rather than netted. The METR calibration finding says the underlying estimate is likely overstated by a wide margin. If the number is going into a business case that someone will later be held to, this is the specific practice that discredits the rest of the case.
The sentence to say instead
When finance asks what the AI programme saved and you do not have a grade-4 answer, the defensible reply has four parts, and it takes about twenty seconds:
- What changed operationally, with the meter that shows it ("days-to-pay fell three days, from the aging report").
- What is not yet measurable, and why ("we cannot yet separate the volume effect from a hiring freeze that started in the same month").
- What the cost side currently totals, including review time.
- The date and condition on which you will have a defensible number.
Nobody in a finance function is surprised that a ninety-day-old change has not settled. What damages credibility is a confident figure that dissolves under one question. Defending a soft number costs more standing, over a longer period, than saying the measurement is three months out.
The Governance Half: You Cannot Measure What You Cannot See
There is a structural reason so many organisations cannot run the method in this article, and it has nothing to do with analytics maturity. The numerator and the denominator live in different places, and a large share of the AI usage is not visible to the company at all.
The scale of that visibility gap is now documented in federal data. In an April 2026 FEDS Note on monitoring AI adoption, Federal Reserve researchers report that the Census Bureau's Business Trends and Outlook Survey put firm-level AI adoption at "about 18 percent of firms" as of year-end 2025, while the Real-Time Population Survey put work-related generative AI use at "about 41 percent of the workforce" as of November 2025. Firms and workers are answering the same question about the same economy and differing by more than twenty points. Some of that is definitional. A meaningful part of it is that employees are using AI the company has not adopted, cannot see, and therefore cannot put in either half of the fraction. Our earlier analysis of shadow AI covers that pattern in depth.
Four things have to be true of a deployment before AI workplace efficiency is measurable at all:
- The usage runs on a path the company can observe, so the denominator includes every call, not only the ones on the corporate invoice.
- Cost is attributed to a team, a tool, and an agent, so cost per unit of work is computable without a reconciliation project.
- Actions are recorded, so the numerator — what was actually completed, and what was refused or rolled back — has a provenance the metric owner will accept.
- Every agent has an owner, so there is a person who can answer for a number that moves.
This is the layer we build. LeapForce is a deployment and governance layer for corporate AI: one controlled path for every AI tool, connector, model and agent, with SSO in front of every AI surface, per-team and per-agent cost attribution that finance can use for chargeback, and a tamper-evident record of what agents read, changed, and were refused. Our AI Gateway rollout guide names the sequence in three words: Observe first. Enforce second. Optimize third. Phase one points one team's traffic at the gateway in observe mode, which exists precisely because you cannot govern or optimise a usage pattern you have not yet measured. Model spend is metered in currency and attributed by team and agent through Model Routing, and the call and action records live in Observability & Audit. LeapForce is in active development and per-capability build status is disclosed honestly on request, so treat that list as what the platform is built around rather than a claim that every line is generally available today.
To be clear about the boundary: none of this measures efficiency for you. LeapForce does not compute your close cycle, own your helpdesk metrics, or tell you whether accounts payable got faster. It makes the AI side of the fraction observable and attributable, which is a precondition for the borrowed meter to mean anything, and the borrowed meter still has to come from the controller.
Where This Is Still Uncertain
Several parts of this argument are weaker than the confident parts, and it is worth being specific about which.
The best measurements are narrow. METR studied 16 experienced developers on open-source repositories. Brynjolfsson and colleagues studied customer-support agents at one firm. Neither generalises cleanly to legal review, financial close, or design. The Danish administrative study is economy-wide but measures earnings and hours, not the ratios a process owner cares about. Anyone claiming a general figure for AI's effect on knowledge work is extrapolating well past the evidence, including anyone claiming it is zero.
Capability is moving faster than the measurement cycle. A grade-4 read takes a quarter and a grade-5 read takes longer, and model capability has changed materially inside those windows. This is a real tension with no clean resolution: the rigorous instruments are always describing tools that are one or two generations old. METR's own February 2026 update is an instance of the problem, not a solution to it. The practical adjustment is to shorten the comparison window where the meter permits it and to re-run the read rather than treating one quarter as settled.
Attribution to AI specifically is often impossible. Deployments rarely arrive alone. A process change, a new system, a hiring freeze, or a reorganisation lands in the same quarter, and a before-and-after cannot separate them. The staggered rollout is the only reliable fix, and it is not always available. Where it is not, the honest report attributes the change to "the April change bundle" rather than to AI.
The absorbed-time destination may dominate and stay invisible. If most saved time is absorbed into the same role rather than converted to volume or cycle time, then measured efficiency will remain small even where individual experience of improvement is genuine — and both the surveys and the ledgers would be telling the truth about different things. We think this is the most likely explanation of the belief gap, but it is an inference from the shape of the evidence, not a finding.
The macro picture is genuinely contested. Productivity growth at the 1947-onward average is compatible with AI contributing nothing yet, with AI contributing something offset by other drags, and with a lag of the kind seen in earlier general-purpose technologies. We do not know which, and neither does anyone quoting the same series in the other direction.
When this method is the wrong fit. If your AI deployment is about capability rather than efficiency, doing something the company could not do at all before, at any staffing level — the ratio framing does not apply, and forcing it produces a misleading negative. Measure those against a delivery outcome, not a rate. Likewise, if the deployment is small enough that a quarter of measurement costs more than the tool, skip the measurement and say so.
Frequently asked questions
Self-reports and instruments disagree by a large margin, so the answer depends on which you trust. In a nationally representative survey published as NBER working paper 32966, Bick, Blandin and Deming found respondents reporting "time savings equivalent to 1.4 percent of total work hours," with 1 to 5 percent of all work hours assisted by generative AI. Timed studies show smaller or negative effects: METR's randomised trial found experienced developers took 19% longer with AI tools available, while believing they had been sped up by 20%. For your own organisation, the only defensible figure for AI workplace efficiency comes from a metric you were already keeping before the deployment.
In practice the terms are used interchangeably, and both mean a ratio of output to input. The Bureau of Labor Statistics defines labor productivity as output per hour: real output divided by hours worked. Workplace efficiency usually refers to the same idea applied to a team or process rather than an economy: invoices per person-hour, tickets per agent-shift, days from request to signature. What matters is not the word but the denominator. A number with no denominator measures activity, not efficiency.
Almost certainly not, because you did not need to create one. Your company already keeps meters for other reasons: the monthly close pack, the helpdesk report, the ATS, payroll — and many of them carry years of history. That is the Borrowed Baseline: find a metric that pre-dates the deployment, is owned by someone outside the AI project, expresses work per unit, and can be netted against cost. If a suitable meter exists, you can produce a before-and-after this week. If none exists, install one and report the wait.
Two reasons compound. First, self-report is badly calibrated for counterfactual questions; METR found people overestimated AI's effect on their task time by 40 percentage points on average. Second, even genuine time savings have four destinations, and the most common one — absorbed into the same role, so the work expands to fill the hours — leaves no trace in any ledger. Savings only become visible when they convert to volume at the same cost, or to cycle time. Humlum and Vestergaard's Danish study found precise null effects on recorded hours while workers reported benefits, which is exactly what absorption looks like in administrative data.
Report AI workplace efficiency as four things and no more: one throughput ratio, one quality meter from the same system, one cycle-time measure, and the full cost side including review time, then attach an evidence grade to each. For example: invoices per AP FTE, post-close adjustments, days-to-pay, and a netted monthly cost, labelled grade 4 (borrowed baseline, same quarter prior year). Do not report seats, prompts, tokens or suggestion-acceptance rates as benefits. Those are adoption and consumption measures, and one of them is a cost. Resist the temptation to invent a new AI KPI or to benchmark against a published industry figure: your own prior-year series is a better comparator than any external benchmark, because it shares your volume mix, your systems, and your people.
Convert time to money only where the time was, or would have been, purchased. Overtime eliminated is cash. Hiring avoided is cash, computed as the FTE you would have needed to handle current volume at the old per-person rate, priced at a fully loaded rate. Time that was absorbed into an existing salaried role is not cash and should not be counted as such. Then subtract the whole cost ledger: licence, inference, verification time, rework, incidents, amortised integration. AI ROI that omits the verification line is the single most common overstatement in this category.
For cycle-time effects, often within a month, because timestamps move quickly. For throughput ratios, plan on a full quarter compared against the same quarter of the prior year, so seasonality does not contaminate the read. Verification cost typically falls over the first two to three months as reviewers learn where the model is weak, which means a ninety-day read and a twelve-month read can legitimately disagree. Record the review-time assumption explicitly so the two reads are comparable when you re-run them.
Report it as a hypothesis, never as a result, and never converted to currency. Aggregated self-report is genuinely useful for one job: telling you where people feel friction, so you know what to instrument next. It cannot size an effect. If an hours-saved figure is going into a business case someone will be held to later, replace it with a borrowed-meter read or state plainly that the measurement is not available yet.
It works better, because a small business has fewer systems and the owner of each meter is easier to reach. You need three numbers and a prior-year comparison, not a platform: units of work per period, headcount or hours applied to them, and the full cost of the AI step including checking time. A spreadsheet and an hour with whoever runs the books is sufficient. The constraint in a small business is usually that the history sits in one person's memory rather than a report, which is worth fixing regardless of AI.
The functions that already count units of work: accounts payable, customer support, IT service desk, recruiting coordination, contract review, and fulfilment. They have per-unit meters with years of history and owners outside any AI project, so they clear all four Borrowed Baseline tests immediately. Functions with no countable unit of output — strategy, design exploration, most management — will stay unproven for longer, and that is a property of the work rather than a failure of the measurement.
Multiply the added seconds of checking per item by monthly volume and a fully loaded hourly rate, then add rework: error rate times correction time. Twenty extra seconds on 4,500 items a month is 25 hours, which is most of a working week, recurring. Record the seconds-per-item assumption in the same place as the result, because it declines with practice and you will want to re-measure it. The 2025 DORA research is the reason to take this seriously at scale: it finds AI adoption associated with higher delivery throughput and, at the same time, a continued negative relationship with delivery stability. That is acceleration someone has to pay for downstream.
Tell them the number, the meter it came from, and the crossover condition. A negative ninety-day read on a project whose benefit scales with volume while its cost does not is a normal early result, and the useful output is the threshold: "this breaks even near 4,700 invoices a month and pays above it, sooner if verification time halves." That is a decision finance can act on. A gross saving with no cost side is not, and it is worse than a negative number because it fails on the second question rather than the first.
Ready to Govern Your AI?
Talk to LeapForce — one controlled layer for every AI tool, connector, model, and agent.
Comments