
AI in customer success is mostly one thing wearing nine costumes: a model that scores an account, and a set of rules that turn the score into who gets attention, who gets a discount, and who gets a human. Everything else, from sentiment tags to QBR summaries to next-best-action, is downstream of that one score. Govern the score's consequences and you have governed the function.
Our position is narrower than the usual advice, and it is the reason we wrote this instead of another list of strategies. The interesting risk in AI in customer success is not that the churn model is wrong. Models are wrong all the time and organisations survive it. The risk is that the score crosses a line, from information a CSM reads to an allocation the company makes, without anyone writing down that the line was crossed. A commenter on Hacker News put the gap plainly in a March 2026 thread about an open-source churn predictor: "Prediction is the easy part." The rest of the comment is about what nobody automates: what the score is supposed to cause.
The short answer: Treat every customer health score as a spending decision, not a metric. Write down what each score band automatically buys the account in attention, discount and human hours, who can override it, and which accounts are deliberately exempt so the model can still learn something it did not already believe.
Last updated: July 31, 2026.
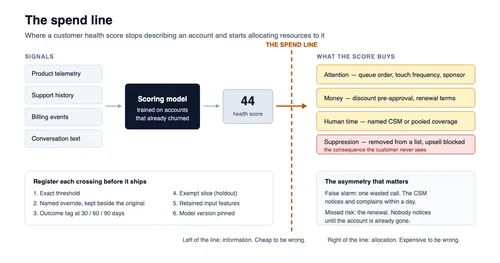
The spend line is the point where a number stops describing an account and starts allocating resources to it.
What AI in Customer Success Actually Changes
AI in customer success is the use of machine-learning models over product telemetry, support history, billing events and conversation text to estimate an account's future behaviour, most often its probability of churning, and to route work accordingly. The change it introduces is not better information. It is that the estimate arrives fast enough, and in a standard enough shape, to be wired directly to an action.
That last clause is the whole story. A quarterly spreadsheet of red and green accounts was also an estimate, and it was also frequently wrong. But it moved at the speed of a human review meeting, and the meeting was the control. When the same estimate refreshes nightly and drops into a queue that assigns outreach, the review meeting is gone and nothing replaced it.
The nine-strategy articles are not wrong about the surface. Churn prediction, health scoring, next-best-action, onboarding personalisation, QBR preparation, sentiment monitoring, journey mapping, CSM coaching and feedback synthesis are all real applications. They are also almost all the same object. Sentiment monitoring produces a feature. Journey mapping produces a feature. Next-best-action consumes the score. QBR prep summarises what the score already decided you would look at. If you govern the scoring and its consequences, you have covered eight of the nine; if you govern the eight separately and leave the score alone, you have covered nothing.
The question this article answers is therefore not "where can AI help customer success" but "at which specific point does an AI estimate in customer success become a decision the company has to be able to defend". Our answer is a single, locatable point, and the rest of the piece is about finding it in your own stack and writing it down.
The Spend Line: Where a Health Score Stops Being Information
The spend line is the first automated step where a health score changes what an account receives. Above the line the score is a number on a dashboard that a person may or may not read. Below it, the score is spending something: a CSM's hours, a discount authority, a support tier, an executive sponsor's calendar, or the account's place in a queue. Find that step and you have found the thing that needs governing.
Most teams running AI in customer success cannot point at their spend line, because it was never designed. It accumulated. Someone built a scoring model. Someone else built a segmentation on top of it so the CSM queue would prioritise sensibly. A third person wired a Slack alert for scores below 40. A fourth added an automated "we noticed you haven't logged in" email at the same threshold. By the time anyone asks who decided that a 39 gets an email and a 41 does not, four people each made a reasonable local choice and none of them made that one.
The spend line matters because everything above it is cheap to be wrong about and everything below it is expensive. A wrong number on a dashboard costs a moment of a CSM's attention. A wrong number that suppressed an account from the outreach queue for two quarters costs the account. The asymmetry is not in the model quality; it is in what the model was permitted to buy.
Three properties make a spend-line crossing worth registering:
| Property | Question to ask | Why it matters |
|---|---|---|
| Automatic | Does the consequence happen without a person choosing it? | An unchosen consequence has no author to ask |
| Material | Does it change money, access or human time? | Cosmetic consequences do not need this machinery |
| Asymmetric | Is being wrong in one direction worse? | Suppression errors are invisible; escalation errors are noisy |
That third row is the one teams skip. A false positive, where the model flags a healthy account as at risk, costs an unnecessary check-in call, and the CSM notices immediately and complains. A false negative, where the model calls a dying account healthy, costs the renewal, and nobody notices until it is gone. These two errors are treated as symmetric by every accuracy metric in common use and they are not remotely symmetric in the business. Any spend line worth the name treats suppression as the dangerous direction.
Prerequisites: Five Things to Have Before a Score Drives Anything
Before you connect a health score to any automated consequence, five things need to exist. None of them are model work. All five are cheap relative to the modelling that usually precedes them, and teams that skip them tend to discover the omission during a renewal dispute.
1. A written definition of the outcome. Churn is not one event. Is a downgrade from twelve seats to three a churn? Is a customer who stops paying but keeps a free tier a churn? Is a merged entity that consolidates onto the acquirer's contract a churn? The model learned some specific answer from your CRM's status field. Whoever wired the model to a consequence assumed a different one. Write the definition down and check it against the training labels.
2. An owner for the score itself. Not the platform, the score. One named person answers: why did this account move from 71 to 44 last Tuesday. If nobody can answer that, the score is not ready to spend anything.
3. A retention of the inputs, not just the output. A score of 44 is useless nine months later. The feature values that produced the 44, logins down 40 per cent, two open severity-2 tickets, admin user departed, are what let you reconstruct a decision. Storing only the score is the most common and most expensive omission we see described in practice.
4. An override path with a record. A CSM who knows the account merged two teams and will look dead for six weeks must be able to say so, and the system must keep both the original score and the override. The NIST AI Risk Management Framework lists this explicitly under subcategory MANAGE 4.1, which requires post-deployment monitoring plans including "mechanisms for capturing and evaluating input from users and other relevant AI actors, appeal and override, decommissioning, incident response, recovery, and change management". Appeal and override are named as first-class components of running a model, not as courtesies.
5. A holdout that predates the rollout. A slice of accounts that will receive normal treatment regardless of score, chosen before the automation goes live. We spend a whole section on this below, because it is the single control that keeps the score honest and it is the one nobody budgets for.
If four of the five are missing, that is not a reason to stop using a health score. It is a reason to keep the score above the spend line, visible to humans and wired to nothing, until they exist. That is a real, shippable interim state and it is much better than the usual alternative, which is wiring first and instrumenting after an incident.
Your Churn Model Predicts the Account Base You Used to Have
A supervised churn model learns from customers who already churned. That is not a technicality; it is the whole content of the model. Every weight in it encodes something about the accounts you sold to two and three years ago, the product they used, the pricing they were on, and the reasons they left — which were frequently reasons you have since fixed.
This is ordinary and unavoidable, and it becomes a governance problem only at the moment the score starts allocating. Three specific distortions matter.
Segment drift. If your last two years of churn were concentrated in self-serve accounts under fifteen seats, the model's strongest signals are the signals that predicted self-serve churn: login frequency, time to first value, single-admin dependency. Point that model at a book of 400-seat enterprise accounts and it will confidently score them on features that never mattered for that segment. The score will still be a number between 0 and 100. Nothing about the output announces that the model is out of its depth.
Proxy leakage. Firms that remove an attribute from the model in order to avoid deciding on it usually have not removed it at all. Ascarza and Israeli's 2022 study in the Proceedings of the National Academy of Sciences found that in personalised targeting, "removing protected attributes from the database does not solve the discrimination problem; instead, removing those attributes often exacerbates the problem by making it undetectable and in some cases, even increases the bias generated by the algorithm". The paper is about demographic attributes in consumer targeting, and the mechanism carries directly to B2B account scoring: drop industry from the feature set and the model reconstructs it from support-ticket vocabulary, contract length and integration mix. You have not stopped scoring on industry. You have stopped being able to see that you are.
Survivorship in the labels. The accounts in your training set that did not churn include a large number that were saved by expensive human intervention. The model does not know that. It records them as healthy and learns the features they had at the time — which were, in many cases, the features of an account being actively rescued. A model trained this way will confidently mark rescued-looking accounts as safe.
None of this makes the model useless. It makes the model a statement about a specific historical population, which is exactly what it is. The failure mode is the sentence "the model says this account is at risk", which erases the qualifier. Try reading it as "the pattern of accounts that left us in 2024 and 2025 resembles this account". Same information, and a CSM can now argue with it.
The Self-Fulfilling Health Score
When a score decides how much attention an account gets, and attention affects whether the account renews, the score's next training set contains its own influence. The model is no longer observing churn. It is partly causing the thing it is measuring, and then learning from the result as if it had merely watched.
This has a name in the machine-learning literature. Perdomo, Zrnic, Mendler-Dünner and Hardt's ICML 2020 paper Performative Prediction opens with the exact condition: "When predictions support decisions they may influence the outcome they aim to predict. We call such predictions performative; the prediction influences the target." Their framework introduces performative stability, in which predictions are "calibrated not against past outcomes, but against the future outcomes that manifest from acting on the prediction". A health score wired to a CSM queue is a performative prediction in this precise sense, and almost nobody in customer success treats it as one.
The dynamics are better documented in a less comfortable domain. Ensign and colleagues' 2018 paper at the Conference on Fairness, Accountability and Transparency, Runaway Feedback Loops in Predictive Policing, starts from the observation that such systems "have been shown susceptible to runaway feedback loops, where police are repeatedly sent back to the same neighborhoods regardless of the true crime rate", then builds a mathematical model proving why the loop occurs when a system is retrained on data generated by its own deployment decisions. Their result is quantitative — the severity of the loop scales with the underlying disparity between areas — and their fix is structural rather than statistical. Change the inputs so that the system's own dispatch decisions stop being the only source of evidence.
Swap the nouns and the mechanism is identical. An account scored red gets four touches a quarter and an executive sponsor. An account scored green gets an automated email. The red account is more likely to survive because of the touches; the green account that was quietly sliding gets no correction and leaves. Next quarter's training data now says green accounts churn at a surprising rate and red accounts are more resilient than expected, and the model, doing exactly what it was built to do, adjusts. Nothing in the pipeline distinguishes "this account was healthy" from "this account was expensively kept alive".
The asymmetry runs the wrong way, too. Low-scored accounts in a de-prioritised tier, the usual efficiency play where the model tells you which accounts are not worth a CSM, get less attention and then churn, confirming the score. The confirmation is real. The causation is backwards. And because the outcome matched the prediction, every accuracy metric you run will report that the model is getting better.
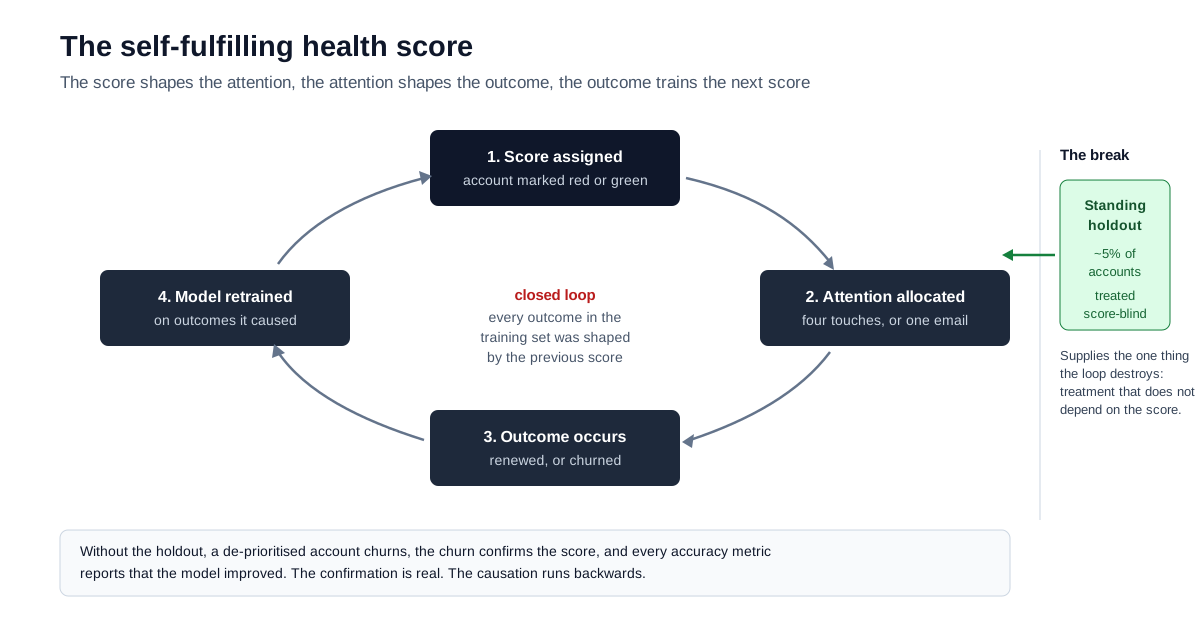
The score-attention-outcome loop closes on itself unless a slice of accounts is treated independently of the score.
Targeting the Highest-Risk Account Is the Wrong Rule
The default rule everywhere in customer success, rank accounts by churn risk and work the top of the list, has been tested against a field experiment and lost. This is the single most useful published finding for anyone building an AI health-score programme, and it is almost never cited in vendor material.
Eva Ascarza's 2018 paper in the Journal of Marketing Research, Retention Futility: Targeting High-Risk Customers Might Be Ineffective, combined two field experiments with machine-learning techniques and concluded that "customers identified as having the highest risk of churning are not necessarily the best targets for proactive churn programs". Her stated implication is that "retention programs are sometimes futile not because firms offer the wrong incentives but because they do not apply the right targeting rules", and her recommendation is to model the heterogeneity in response to an intervention and "target customers on the basis of their sensitivity to the intervention, regardless of their risk of churning". The paper won the Journal of Marketing Research's 2018 Paul E. Green Award.
The logic is obvious once stated and structurally invisible from inside a churn model. Some at-risk accounts are leaving for reasons no CSM can touch. Budget cut. Acquisition. A champion who left for a competitor's product. Spending your scarce retention capacity on them buys nothing. Meanwhile there are accounts at moderate risk where a single well-timed conversation genuinely changes the outcome. A pure risk ranking sorts the first group to the top and the second group to the middle.
| Targeting rule | What it optimises | What it requires | Typical failure |
|---|---|---|---|
| Highest churn risk | Finding accounts likely to leave | One supervised model | Capacity spent on unsaveable accounts |
| Highest predicted response | Finding accounts your action changes | Randomised treatment history | Nothing to train on if you never held anything back |
| Highest revenue at risk | Protecting the number | Risk score plus contract value | Systematically ignores small accounts that later grow |
| Hybrid, risk gated by response | Saveable revenue | Both models plus a holdout | Two models to maintain and explain |
The uncomfortable prerequisite in row two is why this finding stays unused. Modelling sensitivity to an intervention requires history in which similar accounts did and did not receive the intervention, allocated in a way that is not itself a function of the risk score. If your outreach has always gone to the highest-risk accounts, you have no such history, and you cannot build the better targeting rule until you start creating one. Which brings us back to the holdout.
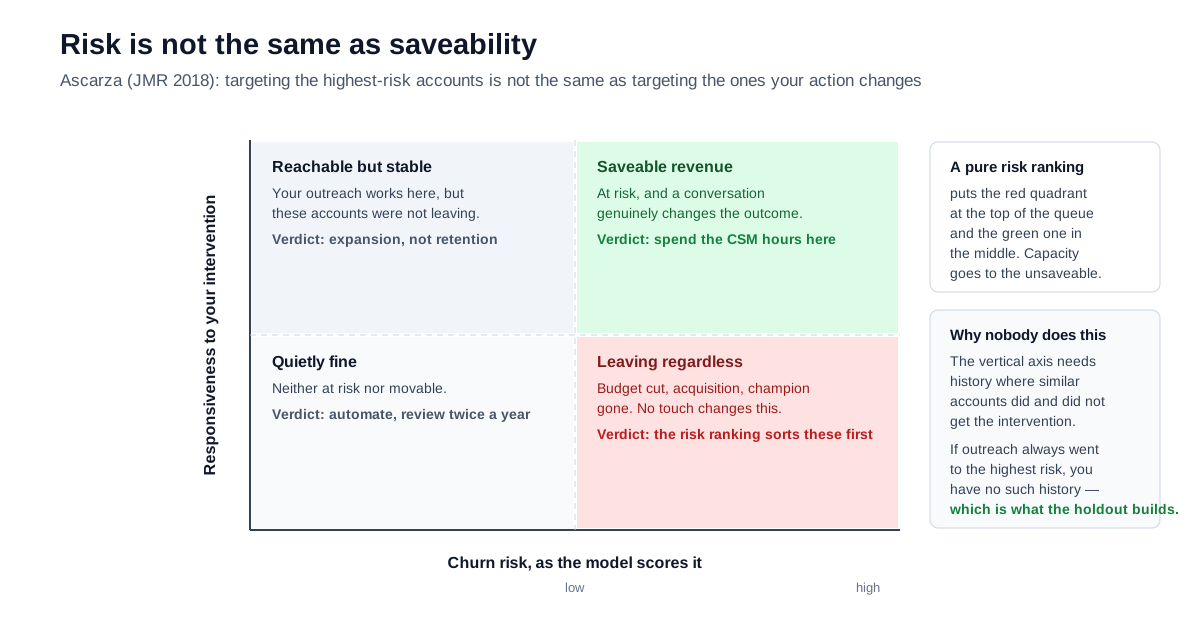
Risk tells you who is leaving. Responsiveness tells you who your intervention can keep.
Run the Spend Line Audit in One Sitting
This is the procedure, and it is the one deliverable we would insist on before any AI in customer success programme connects a score to an automation. It takes two to three hours with the right three people in a room — whoever owns the CS platform configuration, whoever owns the model, and one CSM who works the queue daily. The CSM is not optional; they know about consequences the other two forgot they built.
Step 1. List every automated consumer of the score. Not every dashboard. Every automation: queue sorting, alert rules, email sequences, task creation, tier assignment, renewal-desk routing, discount-approval defaults, executive-review inclusion, QBR agenda generation. Aim for completeness over precision; you can drop rows later.
Step 2. For each, write the exact threshold. "Below 40" is a row. "Bottom quartile" is a different row and behaves differently when the distribution shifts. If nobody knows the threshold, that is your first finding.
Step 3. Classify each row as information or spend. A Slack notification a human then acts on is information. A queue re-sort that determines who gets called this week is spend, even though it feels passive. Suppression counts: an account removed from a list has been spent against.
Step 4. For each spend row, name the override. Who can reverse it, in what interface, and does the reversal get recorded alongside the original value. A row with no override is a row where the model is the final authority, and that should be a deliberate choice rather than an accident of configuration.
Step 5. For each spend row, name the outcome tag. What gets written back after 30, 60 and 90 days: saved, churned, expanded, no-change. A spend row with no outcome tag cannot be evaluated, ever. It is a permanent unmeasured cost.
Step 6. Mark the exempt population. Which accounts are excluded from this row's automation on purpose, and how were they chosen. If the answer is "none", you have a closed loop, and the previous section explains what happens next.
Step 7. Rank by asymmetry, not by volume. Sort the rows by how bad the quiet direction is. Suppression rows to the top. The row that removes low-scored accounts from a queue outranks the row that sends an extra email, even if the email fires a hundred times more often.
Step 8. Fix the top three and leave the rest documented. The register is worth more than the remediation. A team that has written down all nine rows and fixed three is in a far better position than one that fixed whatever it happened to notice.
We call the artifact this produces an allocation register, and the audit that produces it the Spend Line Audit. The name matters less than the discipline of one row per automated consequence, which is what makes the thing reviewable by someone who was not in the room.
Worked Example: A Nine-Row Allocation Register
Here is a complete register for a hypothetical mid-market B2B SaaS book: 620 accounts, eight CSMs, a health score refreshed nightly on a 0–100 scale, and a stack of automations that grew over about eighteen months. It is illustrative rather than a client engagement, and we say so plainly rather than dressing it as a case study. Its purpose is to show what a finished artifact looks like, because "audit your automations" is useless advice without one.
| # | Automated consumer | Threshold | Class | Override | Outcome tag | Exempt slice | Asymmetry |
|---|---|---|---|---|---|---|---|
| 1 | CSM queue sort order | Score ascending | Spend | CSM can pin an account | None | None | High — suppression |
| 2 | Risk alert to CSM channel | < 40 | Information | n/a | None | None | Low |
| 3 | Automated re-engagement email | < 40 and logins down | Spend | CSM can suppress per account | Open/click only | Opted-out contacts | Medium |
| 4 | Executive sponsor assignment | < 30 and ARR > 50k | Spend | VP approves | 90-day renewal outcome | None | Medium |
| 5 | Tier demotion to pooled CS | > 70 for two quarters | Spend | None configured | None | None | High — suppression |
| 6 | Renewal-desk discount default | < 50 sets 10% pre-approval | Spend | Deal desk overrides | Closed-won amount | None | High — money |
| 7 | QBR agenda generation | Any score | Information | CSM edits | n/a | None | Low |
| 8 | Expansion play suppression | < 60 blocks upsell outreach | Spend | None configured | None | None | High — silent |
| 9 | Onboarding escalation | Score at day 30 < 55 | Spend | Onboarding lead | Day-90 activation | None | Medium |
Read the register and the findings fall out without any analysis.
Rows 5 and 8 are the dangerous ones, and neither would have appeared in a conversation about "our churn model". Row 5 moves an account to pooled coverage after two good quarters, a defensible efficiency move, with no override and no outcome tag, which means nobody will ever know how many of those accounts quietly declined afterwards. Row 8 blocks upsell outreach below 60, which sounds prudent and is a self-fulfilling revenue ceiling: an account that never hears about the module that would have solved its problem stays at moderate health, stays below 60, and stays blocked.
Row 6 is the one that will hurt in an audit. A discount pre-approval keyed to a model output means the model is setting price. If a customer later asks why they were offered ten per cent and their peer was not, the honest answer involves a number nobody can reconstruct — unless prerequisite three is in place and the feature values behind that night's score were retained.
Row 1 is worth a second look because it is the least visible spend in the register. Queue order is not a decision anyone made; it is an ordering. But eight CSMs working top-down through 620 accounts means the bottom of the list is functionally unstaffed, and the ordering decided who that was. Sorting is spending.
The remediation for this register is three changes, not nine: add an outcome tag and a six-month expiry to row 5, add an override and a monthly review to row 8, and retain the input features behind row 6. Everything else is documented and can wait.
The Standing Holdout, and What It Costs
A standing holdout is a randomly selected slice of accounts that receive treatment independent of the score, permanently, so that the next model has evidence about what happens when the score is ignored. It is the only control in this article that directly breaks the feedback loop rather than making it visible.
It works because it restores the one thing the closed loop destroys: variation in treatment that is not a function of the prediction. Ensign and colleagues' fix for runaway feedback was to change the system's inputs so its own decisions were not the sole source of evidence, and a holdout is that fix in its simplest form. Ascarza's response-based targeting rule needs exactly the same input — accounts that did and did not get the intervention, allocated independently of risk — which is why the two findings point at one control.
Design decisions, in the order they come up:
| Decision | Options | What we would pick |
|---|---|---|
| Direction | Hold back treatment from low scorers, or give treatment to low scorers | Both, in separate slices — the second is the ethical one |
| Size | 1–10% of accounts | Large enough that a quarter produces a readable number; usually 5% |
| Rotation | Fixed cohort or rotating | Rotating annually, so no account is permanently under-served |
| Selection | Random within segment | Random, stratified by ARR band and tenure |
| Consent | Silent or disclosed | Disclosed to the CSM, never framed to the customer as an experiment |
The direction row deserves the discomfort it causes. A holdout that withholds attention from accounts the model flagged is a decision to under-serve real customers to learn something. Some organisations will find that unacceptable, and that position is defensible. The inverse slice, where you deliberately give normal or enhanced attention to accounts the model scored as not worth it, costs money instead of goodwill, produces the same counterfactual evidence, and is the version we would argue for in most books of business.
Cost is the honest objection. A 5 per cent holdout on 620 accounts is 31 accounts, and if the model's suppression rules were actually saving capacity, you are giving that capacity back. The counter-argument is not that the holdout is free. It is that without it, every number you produce about the model's performance is measuring a system that grades its own homework, and you will not find out until a year of retention data has been shaped by an unexamined rule.
There is a cheaper interim version worth naming: a decision log with periodic reversal. Keep the automation, but each month select ten suppressed accounts at random and treat them normally, recording the outcome. It is not a clean experiment and will not support a response model. It is enough to notice that the suppression rule is wrong, which is the failure you are most likely to have.
How Accurate Is AI Churn Prediction, Really
The honest answer is that published accuracy figures for churn models are not comparable across companies, and the number that matters is not accuracy at all — it is what the model buys you above the simplest rule you could have written by hand. Anyone quoting a single percentage without naming the base rate, the prediction window and the baseline is quoting noise.
The mechanics are worth stating because they are the source of most inflated claims. If 5 per cent of your accounts churn per quarter, a model that predicts "nobody churns" is 95 per cent accurate. Accuracy on an imbalanced problem is a nearly meaningless statistic, which is why practitioners use precision and recall at a chosen threshold, or a ranking metric such as AUC. A model with an AUC of 0.80 is meaningfully better than random at ordering accounts and can still be wrong about any individual account you name.
Field practitioners are candid about the ceiling when they are not selling. In the same March 2026 Hacker News thread, a commenter reported that in a large dataset of SaaS cancellation conversations, "login frequency alone predicts churn" at roughly 70 per cent accuracy at 60 days out, rising to about 85 per cent with usage depth and ticket sentiment added. We cannot independently verify that dataset and we present it as a practitioner's report rather than a benchmark. The structurally interesting part is not the figure but its shape: one crude feature carries most of the signal, and the elaborate model adds a slice on top. Before you buy a platform, run the one-feature version and find out how big your slice actually is.
The developer who posted that project described the state of the art in public churn work in one line worth reading if you are evaluating tooling: every notebook "uses the Kaggle Telco dataset and outputs a confusion matrix that no founder can act on". That is an accurate description of the gap between churn modelling as an ML exercise and churn management as an operating decision.
What accuracy does not buy you, at any level:
- Reasons. A high-performing model tells you an account resembles accounts that left. It does not tell you whether this one is evaluating a competitor, hit an unreported bug, or had a champion go on parental leave. Feature attribution methods narrow the search; they do not answer the question.
- Saveability. Covered above — this is Ascarza's finding, and it is orthogonal to accuracy. A perfectly accurate risk model still ranks unsaveable accounts first.
- Timing. A model that is right about the year and wrong about the quarter is not actionable, and the training label rarely encodes when the decision to leave was actually made.
- Permission. Being right does not make an automated consequence appropriate. That is the whole spend-line argument.
Score Decay: The Model Ages Faster Than the Playbook
Model quality degrades with time since training, and it does so more reliably than most teams assume. Vela and colleagues, publishing in Scientific Reports in 2022, ran what they describe as the first systematic analysis of AI "aging" across 32 longitudinal datasets from healthcare operations, transportation, finance and weather, and four standard model classes. Across all 128 model-dataset pairs, "we observed temporal model degradation in 91% of cases".
Those are not customer-success datasets, and we are not going to claim the percentage transfers. What transfers is the base rate of the phenomenon: degradation with model age is the normal outcome, not the exception, even under stable conditions and with model classes chosen for robustness. A customer-success environment is considerably less stable than the weather in Basel. Your product ships changes weekly, your pricing changed twice, your ICP moved upmarket, and every one of those events breaks the correspondence between the training population and the scored population.
The governance implication is specific: the threshold ages faster than the model. A retrained model can shift its score distribution while remaining equally predictive, and every hard threshold in your allocation register then means something different. If the median account score drifts from 62 to 55 after a retrain, the "below 40" alert now fires on a materially different slice of the book, and no alarm anywhere in the stack tells anyone. This is the failure that makes the audit worth repeating rather than doing once.
Three checks, in increasing order of effort:
| Check | Frequency | What it catches |
|---|---|---|
| Score distribution snapshot before and after every retrain | Every retrain | Thresholds silently changing meaning |
| Precision and recall at each register threshold, on outcomes | Quarterly | The model degrading in the band you actually act on |
| Re-run the Spend Line Audit | Twice a year | New automations added since the last register |
None of these are sophisticated. NIST's framework treats them as ordinary operating requirements: subcategory MEASURE 2.4 asks that "the functionality and behavior of the AI system and its components ... are monitored when in production", which covers the first two rows, and GOVERN 1.5 requires that "ongoing monitoring and periodic review of the risk management process and its outcomes are planned" with the review frequency determined in advance, which is the third. Deciding that cadence before the model ships is the part teams skip.
Show the CSM an Estimate, Not a Fact
How a score is displayed is a governance control, not a design preference. A number rendered as "Health: 44" in a bold coloured badge reads as a measurement. The same information rendered as "44, from logins down 40% and two open S2 tickets — last scored Tuesday" reads as an argument, and a CSM can disagree with an argument.
This is the cheapest intervention in the entire article and it is routinely skipped because it looks cosmetic. It is not. A CSM who believes the score is a fact will not override it, will not report that it looks wrong, and will treat the account according to the number. A CSM who sees the score as an estimate with visible inputs becomes the monitoring layer you were going to have to build anyway. Their disagreements are the highest-quality signal you can get about model drift, and they cost nothing to collect.
Four display rules we would apply to any health score wired below the spend line:
- Show the top contributing features with the score, always. Not on a detail page behind a click. In the same view where the decision gets made.
- Show the score's age. "Last scored 6 days ago" prevents a stale number driving a live conversation.
- Show the confidence or the band, not a false-precision point. A score of 44 and a score of 47 are not distinguishable by any model you own. Displaying bands rather than integers removes an argument nobody can win.
- Make the override one click and make it ask why. The free-text reason is the training data for next year's model. It is also the audit record for the section below.
There is a version of this that goes wrong. Feature attributions can be persuasive and misleading at once: a plausible-looking explanation attached to a wrong prediction makes the wrong prediction harder to challenge, not easier. Presenting attributions as "the model weighted these signals most heavily" rather than "here is why this account is at risk" is a small wording change that keeps the claim honest.
Justifying the Discount Nine Months Later
The record you need is not the score. It is the score plus its inputs plus the human decision, retained together, for as long as the commercial consequence can be questioned. Renewal disputes, deal-desk reviews, procurement escalations and internal post-mortems all arrive months after the fact, and by then the model has been retrained twice.
Consider row 6 of the register above: a health score below 50 sets a 10 per cent discount pre-approval. Nine months later a customer's procurement team asks why a comparable account received a different offer. The answer needs four artifacts, and most stacks retain one of them.
| Artifact | Usually retained? | Why it matters |
|---|---|---|
| The score at decision time | Yes | Establishes what the rule saw |
| The feature values behind it | Rarely | The only way to explain the score |
| The model version and its training window | Rarely | The score is meaningless without it |
| The human approval and any override reason | Sometimes | Establishes who decided |
Retaining only the first produces an answer of the form "the system flagged them" — which is exactly the sentence that turns a routine question into an escalation, because it names no author. This is a records problem before it is a modelling problem, and it is the same records problem we described for agent actions in our earlier analysis of AI observability and audit trails: the useful record is the one that captures the decision context, not just the output.
Two practical notes. First, model version pinning costs almost nothing at write time and is nearly impossible to reconstruct later — write the version identifier next to every score you persist. Second, retention windows should be set from the commercial exposure, not from the data-engineering convenience: if a contract can be disputed for twelve months, twelve months of feature history is the floor, and a 90-day rolling window is not a policy, it is a default nobody chose.
We are describing operational record-keeping, not legal compliance. Where a scoring decision affects an individual rather than a corporate account, or where sector rules apply, the retention and explanation obligations are a question for your counsel and not for this article.
Common Mistakes in AI Health Scoring
These are the recurring ones, ordered roughly by how expensive they are and how invisible they stay.
Scoring the account and acting on the contact. The model scores an account; the automation emails a person. The person who stopped logging in may be one of eleven users, and may have changed roles. Account-level signal driving contact-level action produces a stream of irrelevant outreach that trains customers to ignore you.
Treating the threshold as the model. Teams argue for weeks about model architecture and set the alert threshold in an afternoon. The threshold determines the volume, the precision and the entire cost profile of the programme. It deserves more scrutiny than the algorithm, and it should be re-derived from outcomes rather than picked as a round number.
Letting the score include your own activity. A distressing number of health scores include CSM engagement as a positive input: meetings held, emails exchanged, tickets touched. This makes the score partly a measure of how much attention the account already got, which means high-touch accounts look healthy because they are high-touch. It is the feedback loop compressed into a single feature.
Averaging away the signal. A composite score blends product usage, support, sentiment and billing into one number, and a serious problem in one dimension gets diluted by three healthy ones. An account with perfect usage and an unpaid invoice is not a 78. Composite scores should be accompanied by a floor rule: any single dimension below its own threshold surfaces regardless of the composite.
Rolling out to the whole book at once. There is no reason to. Run the score in observe mode on one segment, compare its calls against what the CSMs actually did, and only then wire the first consequence. This is the sequencing our own AI gateway rollout guide prescribes: observe first, enforce second, optimize third. It applies to any model that will eventually make allocations.
Deleting overridden scores. When a CSM overrides, some systems replace the score. Keep both. The disagreement between model and human is the most valuable row in the table and the only cheap source of labelled model error you will ever have.
Assuming the vendor's model is your model. A platform's out-of-the-box score was fitted somewhere, on somebody's data. Ask which. If the answer is "a blend across our customer base", the model encodes the churn dynamics of an average of businesses that are not yours, and the segment-drift problem above applies with force.
When a Hand-Built Score Still Wins, and Where We Are Unsure
Below roughly a few hundred accounts, or fewer than about fifty churn events in the training window, a hand-weighted rules-based score is usually the better instrument — not because machine learning is inappropriate at that scale, but because a rules-based score is legible, arguable and stable, and those three properties are worth more than a few points of ranking quality when the whole book fits in one person's head. A CSM can dispute "we weighted the missing admin at 20 points" in a way they cannot dispute a gradient-boosted output.
A hand-built score also has a real advantage the literature does not capture: its assumptions are visible enough that the segment-drift problem announces itself. When the rules stop matching the business, someone says so in a meeting. When a model stops matching the business, the numbers keep arriving in the same format.
Where we are genuinely uncertain, stated plainly:
- We do not know the right holdout size for a small book. Five per cent of 200 accounts is ten accounts, which will not produce a readable quarterly signal. The honest answer for small books may be periodic reversal rather than a standing holdout, and we have not seen published work settling this.
- We have not run a churn model in production ourselves. LeapForce builds the deployment and governance layer for enterprise AI; we do not operate a customer-success scoring product, and nothing in this article is a report of our own model's performance. The recommendations are derived from published research and from the governance patterns we do operate. Where we would normally give you a measured number from our own run, we have given you a mechanism instead, and you should weight it accordingly.
- The evidence base is thinner than it looks. Ascarza's field experiments are the strongest published result here and they are not from B2B SaaS. The performative-prediction and feedback-loop literature is theoretically solid and has not been tested on customer health scores specifically. We are reasoning by mechanism, and we have said so at each point rather than borrowing the confidence of adjacent findings.
- We could not verify the commonly quoted market figures. Gartner and Forrester statistics on customer-success AI adoption circulate widely in vendor content; the primary reports sit behind paywalls we did not clear, and Reddit's customer-success communities were not reachable through our fetch ladder on the day of writing. Rather than reproduce those numbers second-hand, we have left them out, and this article contains no adoption-percentage claims as a result.
Where the Governance Layer Fits
Everything above is about one model and its consequences, which is why AI in customer success looks like a departmental problem for about a year. The reason this becomes a platform problem rather than a customer-success problem is that the health score is rarely the only model making allocations inside the same company, and it is never the only one after the first year. The support-triage model routes tickets. The lead-scoring model allocates sales attention. The renewal-forecast model shapes the number the board sees. Each one has its own spend line, its own thresholds picked in an afternoon, and its own quietly closed loop.
That is the layer LeapForce builds: one governed place where AI systems get an owner, a scope, a record of what they did, and a policy that is enforced in the request path rather than written in a wiki. Our observability and audit work is aimed squarely at the record problem this article keeps returning to — retaining what a system decided, on what basis, and what was refused, in a form that survives a question asked nine months later. Non-human identities are first-class in our access and identity model: an automation that acts on accounts has an owner, a scope and an expiry, the same as a person would.
To be direct about the limit: LeapForce does not build churn models or customer health scores, and adopting a governance layer will not tell you whether your score is any good. What it changes is whether the consequences are visible, attributable and reversible — which is the half of the problem that a customer-success platform will not solve for you. Per-capability build status on our platform is disclosed openly, and the honest read is that the governance layer around models is the part we operate, while the model itself remains yours.
If you want the adjacent reading, our analysis of customer onboarding automation covers the mirror-image decision at the start of the lifecycle, where an automated system grants access rather than allocating attention.
Frequently asked questions
No, though they are usually built from the same data and increasingly from the same model. A churn prediction estimates the probability of a specific outcome in a specific window. A customer health score is a composite index intended to summarise the relationship, often blending usage, support, sentiment and billing. The practical difference is that a churn probability can be evaluated against what actually happened, and a composite health score frequently cannot, because nobody defined what outcome it was predicting. If your health score has no stated target variable, it cannot be validated, and it should stay above the spend line.
There is no transferable number, and any single percentage quoted for AI in customer success without a base rate and a prediction window is not informative. Because churn is rare, a model that predicts nobody churns can be 95 per cent accurate on a quarterly 5 per cent churn rate, which is why practitioners use precision and recall at a chosen threshold or a ranking metric such as AUC. The more useful comparison is against the simplest baseline you could build by hand: run a login-frequency-only rule first, measure it, and treat the model's improvement over that as the real number.
Not on current evidence, and the framing hides the real change. What AI in customer success reallocates is CSM attention rather than CSM headcount — the model decides who gets called, and the model's targeting rule is where the value is won or lost. Ascarza's field-experiment finding that highest-risk targeting underperforms response-based targeting means an organisation can automate perfectly and still spend its retention capacity on accounts nothing could have saved. The CSM's judgment about which accounts are actually reachable is the input the model does not have.
Every automated consequence in the allocation register, with a recorded reason, unless there is a specific stated reason not to. The NIST AI Risk Management Framework names "appeal and override" as a component of post-deployment monitoring, not as an exception path. In practice the highest-value override is on suppression rules: de-prioritisation, tier demotion, blocked outreach. Those are the decisions the customer never sees and never complains about, which makes the CSM the only detector you have.
Large enough that a quarter's outcomes produce a readable difference, which for most mid-market books lands around 5 per cent, stratified by contract value and tenure. Below a few hundred accounts a standing holdout will not produce a usable signal and periodic reversal is the honest substitute: each month, take ten accounts the automation suppressed, treat them normally, and record what happened. Neither version supports a full response model at small scale, but both catch a suppression rule that is simply wrong.
Set the cadence in advance from the rate at which your business changes, not from a default, and check the score distribution before and after every retrain. The published evidence on model aging is that degradation over time is the normal case rather than the exception — Vela and colleagues observed temporal degradation in 91 per cent of 128 model-dataset pairs across four industries. The operationally dangerous part is not the model getting slightly worse; it is the score distribution shifting so that every fixed threshold in your automation quietly means something new.
For scores about corporate accounts, the answer today is mostly unsettled rather than clearly yes or no, and it is not one this article should resolve for you. Frameworks such as the NIST AI Risk Management Framework and ISO/IEC 42001 are voluntary and describe practices rather than obligations. Where a score drives a decision about an identifiable individual, or where sector-specific rules apply, obligations may attach. That is a question to put to your own counsel with your specific facts, not one to settle from a blog post. What is not in doubt is the operational requirement: if a model influenced a commercial decision, you should be able to reconstruct what it saw and who approved the outcome.
The model is the cheap part. The recurring costs are the ones this article has been describing: retaining feature values alongside scores rather than scores alone, building and maintaining an override path with recorded reasons, tagging outcomes at 30, 60 and 90 days on every automated consequence, and carrying a holdout that gives back some of the capacity the automation was supposed to save. A programme that budgets for the model and not for those four items will produce a score nobody can defend. That is a worse outcome than not having one.
Start above the spend line and in one segment, which is the cheapest way to introduce AI in customer success without inheriting a governance problem. Build the simplest defensible score, a handful of weighted signals you can explain in a sentence each, then show it to CSMs for a quarter with no automation attached, and record where they disagree with it. Those disagreements are your first genuine evaluation set and they cost nothing. Only after you can say how often the score was wrong, and in which direction, should any automated consequence be connected to it.
One named person, and the useful test is whether they can explain a specific account's movement without opening a ticket with data science. Ownership that sits with a platform team produces a score nobody in customer success trusts; ownership that sits entirely with customer success produces a score nobody maintains. The workable arrangement we see described most often is a named owner in the revenue organisation who is accountable for the register and its outcomes, with modelling support from wherever it lives.
Ready to Govern Your AI?
Talk to LeapForce — one controlled layer for every AI tool, connector, model, and agent.
Comments