
Automated lead qualification is a filter. Software reads a form fill, some enrichment data and a behaviour trail, then decides which prospects a human ever speaks to. Most of what it produces is rejections, and the rejections are the half almost no reporting stack measures.
Our position is that this is the whole governance problem in one sentence: a qualification model's error rate is measurable in one direction only. When it wrongly accepts a lead, a rep works it, the deal dies, and the loss lands in the CRM as a closed-lost record the model can learn from. When it wrongly rejects a lead, no rep calls and no worked-lead outcome is ever recorded. Some rejected inbound leads do buy later through a self-serve path, which gives you a partial and biased signal; the ones who quietly go elsewhere give you none at all. Either way the deal you would have won by calling cannot appear in any report, so the model is rarely shown to have been wrong about it. That is not a reporting gap you can close with a better dashboard, because the data was never generated. A marketer who spent years running six-figure monthly ad budgets for law firms, writing on Hacker News in February 2026 to launch a tool that sells exactly this fix, put the upstream version of the problem plainly: an ad platform "optimizes on what it can see" — a form fill, a phone call — and has no idea what happened after that (obrien_leo, Hacker News, 17 February 2026). A qualification model has the mirror-image blind spot, one step downstream: it can see everything that happened to the leads it passed, and nothing at all about the leads it stopped.
The short answer: You cannot measure automated lead qualification from the accepted side. Work a random 2 to 5 percent of the leads the model rejected, compare their conversion rate against the accepted cohort's, and you have an error rate. Without that sample you have a satisfaction rate, not an accuracy rate.
Last updated: July 31, 2026.
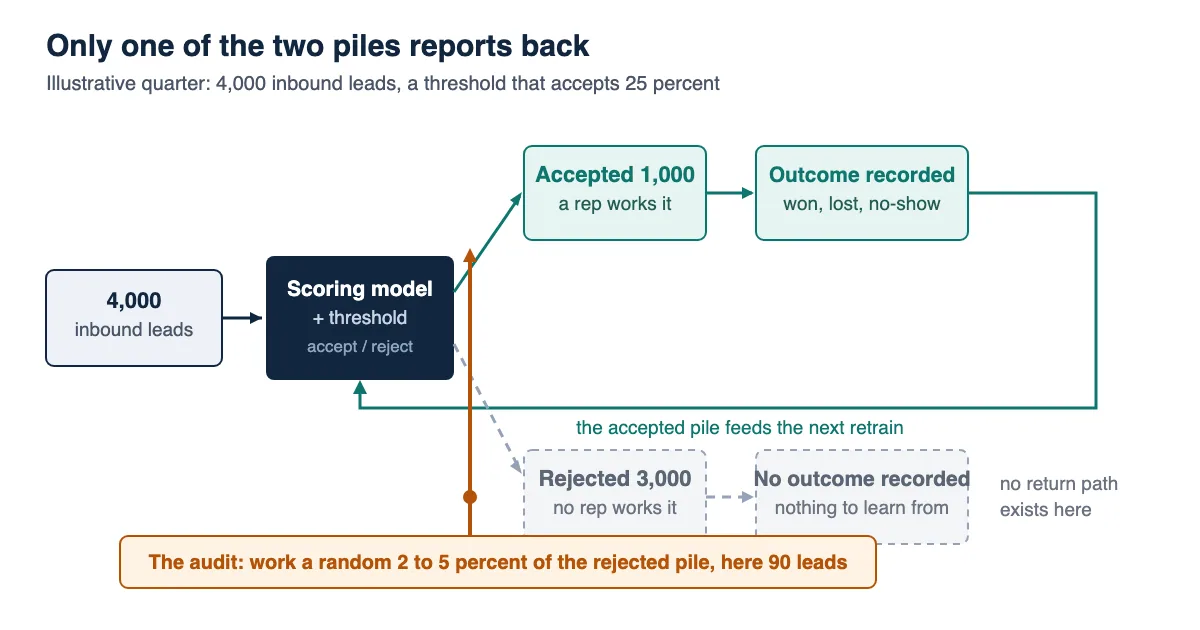
The accepted pile reports back. The reject pile does not, unless you pay for a sample that does.
We have not run a reject-pile audit ourselves and we are not going to pretend otherwise. Everything below is a procedure built from published research on the identical problem in credit scoring, plus arithmetic on stated assumptions that you can re-derive line by line against your own numbers. Where a figure is illustrative rather than measured, it says so in the sentence.
What automated lead qualification actually decides
Automated lead qualification is the software layer that sorts inbound and sourced prospects into ones a human will contact and ones a human will not. AI lead qualification is the same object with a learned model in the scoring slot instead of a rule table, and everything in this article applies to both. It is usually a scoring model plus a routing rule: a score above a threshold books a meeting or lands in a rep's queue, a score below it goes to a nurture sequence, a self-serve path, or nowhere at all. The decision it makes is not "is this lead good" but "does this lead get a person".
That distinction matters more than any feature list, because it tells you what the system is actually spending. It spends attention. Rep capacity is the scarcest input in a sales organisation, and the qualification model is the thing allocating it. The guides we read frame it as a productivity tool, which it is, but the productivity comes from withholding effort from most of the queue.
Two things it is not, both worth stating because the field blurs them:
It is not lead generation. Generation creates records. Qualification decides which of the existing records get worked. A generation problem and a qualification problem produce the same symptom, a thin pipeline, and have opposite fixes.
It is not a prediction, operationally. A predictive score is a probability statement about a lead. A qualification decision is an irreversible resource allocation made from that statement, and the two have different failure modes. HubSpot's own documentation describes its Likelihood to close property as "a score that represents the percentage probability of a contact closing as a customer within the next 90 days" (HubSpot knowledge base, fetched 31 July 2026). A probability is a claim that can be checked against outcomes. A threshold applied to it is a policy, and it is the policy, not the probability, that decides whether the outcome ever exists to check.
| Component | What it produces | Who normally owns it | Whether it is audited |
|---|---|---|---|
| Enrichment | Firmographic and contact fields | RevOps or a data vendor | Field fill rates, sometimes |
| Scoring model | A number or grade per lead | Marketing ops, or the CRM vendor | Score distribution, usually |
| Threshold | The accept/reject cut | Whoever set it, and check when | Ask your team |
| Routing | Which rep, which queue, which sequence | Sales ops | SLA timers, usually |
| The reject path | Nurture, self-serve, or nothing | Worth checking who claims it | The subject of this article |
The bottom two rows are where this article lives. The threshold and the reject path are the parts of the system that decide the most and get inspected the least.
Why the reject pile has no feedback loop
The reject pile is unaudited for a structural reason, not a cultural one. Outcomes exist only for leads someone worked, so the data available for evaluation is not a random sample of the leads that arrived. This has a name in the machine-learning literature: the selective labels problem.
The canonical statement of it comes from a KDD 2017 paper by Himabindu Lakkaraju, Jon Kleinberg, Jure Leskovec, Jens Ludwig and Sendhil Mullainathan, which describes domains "where the data is selectively labeled in the sense that the observed outcomes are themselves a consequence of the existing choices of the human decision-makers" (The Selective Labels Problem: Evaluating Algorithmic Predictions in the Presence of Unobservables, KDD '17). Their running example is judicial bail: you observe whether a defendant failed to appear in court only if a judge released them. The paper's central warning transfers to sales without modification, and the authors put it in one line: "the instances for which outcomes are observed do not represent a random sample of the population."
Swap judge for scoring model and bail for a meeting booked, and you have the qualification funnel exactly. The leads with outcomes are the leads the model liked. Retrain on them and you are fitting a model to its own past preferences.
Credit scoring has lived with this longer than sales has, and its vocabulary is more precise. A 2019 paper on reject inference states the mechanism without hedging: lenders train scoring models "on data from previously granted credit applications, where the borrowers' repayment behavior has been observed," which "creates sample bias," because the scoring model is "trained on accepted cases only" (Shallow Self-Learning for Reject Inference in Credit Scoring, arXiv, September 2019). Applying that model to the whole applicant population, the paper notes, degrades its performance.
Nikita Kozodoi, one of that field's researchers, gave a short talk on the same mechanism that is worth eighteen minutes if you want the statistical picture rather than the sales one. It is about credit rather than pipeline, which is the point: the discipline that has studied this problem hardest is not the one selling you qualification software.

There is a second reason the loop stays broken, and it is organisational. In a lending decision the rejection is at least an event: someone is told no, a record exists, a regulator may ask about it. In a sales funnel, a rejected lead is usually not told anything. The lead goes into a nurture list or a lower-priority queue and experiences the outcome as silence. Ask whose number moves when that silence is wrong, and in most reporting structures the answer is nobody's. Marketing is measured on leads delivered. Sales is measured on the pipeline it worked. The leads that fell between the two sit outside both measurements.
We looked at the two top-ranking guides for this keyword that we could fetch in full, from Lindy and Bland AI. Between them they carry well over sixty headings covering setup, scoring design, routing, retraining, data hygiene and tool selection. Neither has a heading about the leads the system turns down. Bland's guide gets closest, with a section on turning sales feedback into model training data, but sales feedback is by definition feedback from leads sales worked. Both do touch the idea in their body text, and Bland's is the closer of the two: it tells readers to have sales flag false negatives and to use a holdout group when validating scoring changes. So the fair claim is narrower than "nobody discusses this". It is that the reject side gets a sentence where setup, routing and tool selection get a section each, and that no procedure for measuring it is given.
The metric that looks like accuracy and is not
Here is the trap in its sharpest form. Every metric your qualification stack can compute from its own data is a statement about the accepted pile. Conversion rate of qualified leads. Opportunity rate by score band. Average deal size from high-scoring contacts. All of these can improve while the system gets worse, and the mechanism is documented.
A June 2026 paper by Bruno Scarone and Ricardo Baeza-Yates evaluated reject-inference methods in credit scoring and found what they call a structural failure mode: "models whose accuracy improves while recall collapses create an illusion of improvement that leads practitioners to believe the system is getting better" (The Illusion of Improvement: Reject Inference Strategies in Credit Scoring, arXiv, 16 June 2026), while what they call the model's rejection quality, its ability to correctly screen out the bad cases, is deteriorating. Their stated conclusion is that "standard evaluation protocols are inadequate for assessing models trained under survival bias."
Translate that into a sales funnel. A model that becomes more conservative, passing fewer leads and passing only the obvious ones, will show a rising conversion rate on qualified leads. That is precisely the number that goes in the board deck. Meanwhile the number of winnable deals it is discarding is going up, and no standard report in the company moves in response.
The reason is a missing quadrant. Lay out the four outcomes of a qualification decision:
| Would have bought | Would not have bought | |
|---|---|---|
| Model accepted | Observed: closed won | Observed: closed lost, or no-show |
| Model rejected | Not observed | Not observed |
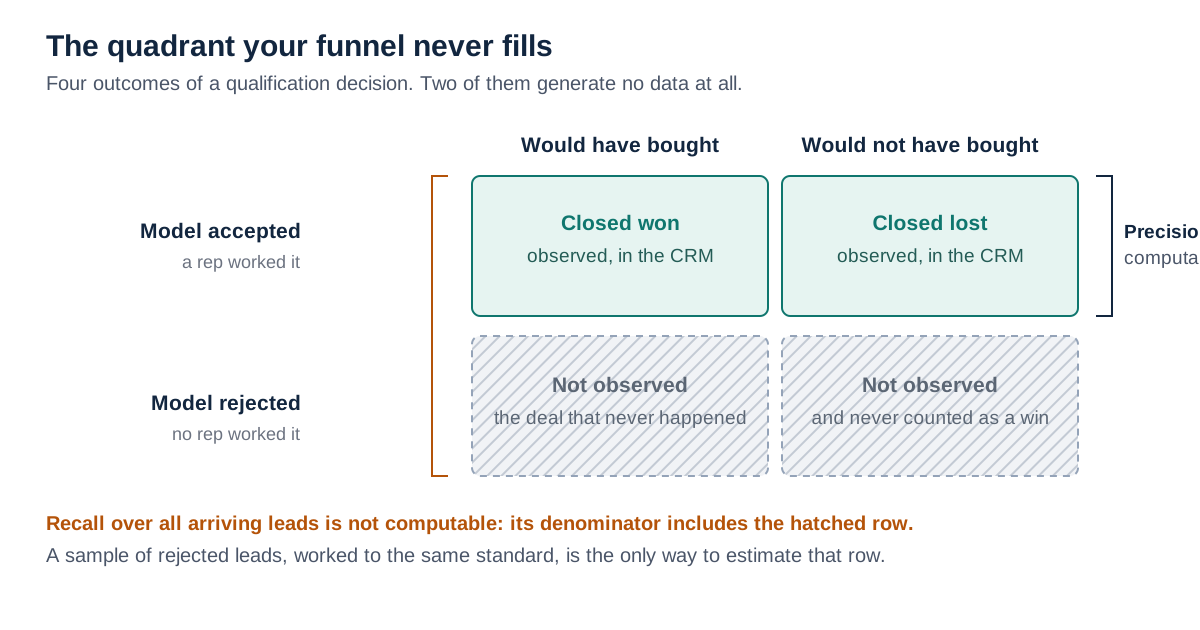
Precision over the accepted row is computable. Recall needs the row nothing measures.
Your CRM populates the top row. The bottom row is empty, and no amount of analysis on the top row will fill it, because the two rows describe different populations. Precision on the accepted cohort is computable. Recall over all arriving leads is not, because its denominator includes a cell nothing measures.
That asymmetry has a direction, and it is the reason the damage accumulates quietly. A false accept is self-correcting: the rep works a bad lead, wastes two hours, complains, and the complaint reaches whoever tunes the model. A false reject is self-concealing: the lead goes quiet, buys from a competitor eight months later, and nothing in the reporting connects the two events. Over enough cycles a system optimised only against complaints will drift toward rejecting more, because rejecting more reduces complaints.
Scarone and Baeza-Yates measured this trade-off directly and found that the two metrics point in opposite directions: "accuracy favors no exploration, while rejection quality improves with it." If you are optimising for the metric your dashboard shows, the correct move is to never test the reject pile. That is the whole problem in one finding.
What your CRM's own scoring reports do and do not show
Start with the reporting your platform ships with. HubSpot's lead score performance report, per its knowledge base article fetched on 31 July 2026, presents the total number of records scored against the total in the account, the average, minimum and maximum scores, the distribution of records across threshold labels, and a trend of monthly average, maximum and minimum scores over a default 365-day window (HubSpot knowledge base).
Read that list again. Every item is a property of the score. None is a property of the decision. You can see what share of your contacts landed in the top band, and whether the average score drifted since last quarter. You cannot see, from that report as documented, what happened to the contacts in the bottom band, because what happened to them is mostly nothing.
HubSpot is also unusually candid about the model's interpretability. Its predictive scoring documentation states that the company uses "blackbox machine learning to provide predictions," where "the input and outputs of the model are known, but it is unknown how the input is transformed into the output" (HubSpot knowledge base). We would rather have that sentence than a reassuring explanation that is not true. It does mean "ask the model why" is not an available audit route there, which pushes you back to outcome testing.
What we could not verify. Salesforce's Einstein Lead Scoring help article renders through JavaScript and returned an error shell to both a direct fetch and a browser-agent request on 31 July 2026, so we cannot quote what Salesforce publishes about the data its lead model trains on or what its scoring reports contain. Treat any claim you read about Einstein's training set as unverified until you read the vendor page yourself. We would rather leave the hole than fill it with a plausible guess, and this source is recognisable enough that its absence deserves stating rather than hiding.
We verified this on one platform only, and we would expect the same shape elsewhere for the same structural reason: platform-native scoring analytics are built to answer "is the model producing a sensible spread of scores", which is a model-health question. The question this article is about, "is the threshold discarding revenue", is a decision-quality question, and it needs data the platform does not have because the platform never generated it.
| Question | Answerable from platform reporting | Needs a reject sample |
|---|---|---|
| Are scores well distributed? | Yes | No |
| Has the average score drifted? | Yes | No |
| Do high-scoring leads convert better than mid-scoring ones? | Yes, if you join scores to outcomes yourself | No |
| Do rejected leads convert at all? | No | Yes |
| Is the threshold set in the right place? | No | Yes |
| Has rejection quality degraded since the last retrain? | No | Yes |
BANT, CHAMP and the framework question that does not matter here
The guides we read spend a section picking between qualification frameworks, so it is worth saying plainly where they fit. A lead qualification framework tells you which attributes to ask about. It has nothing to say about whether your cut-off is in the right place, and it does not generate outcome data for the leads it screens out. Two teams using the same framework with different thresholds will discard wildly different amounts of revenue, and the framework is silent on both.
| Framework | What it asks about | Where it helps | What it cannot tell you |
|---|---|---|---|
| BANT | Budget, Authority, Need, Timeline | Structuring a discovery call; consistent notes | Whether a no-budget-today lead becomes a buyer in six months |
| CHAMP | Challenges, Authority, Money, Prioritisation | Leading with the problem rather than the wallet | The same thing, in a different order |
| MEDDIC | Metrics, Economic buyer, Decision criteria and process, Identify pain, Champion | Complex enterprise deals with long cycles | Anything about leads that never reached a champion conversation |
| Fit-plus-engagement scoring | Firmographic fit combined with behaviour | Ranking a large inbound queue quickly | Whether the ranking is right below the cut line |
| Predictive or AI scoring | Whatever correlates in historical data | Surfacing non-obvious signals at volume | Anything about the population it was never trained on |
The last row is the one to sit with. A predictive model's blind spot is not a bug in the vendor's implementation. It is a property of every model trained on the outcomes of prior decisions, and the more accurate the model looks on its own historical data, the more confidently it will reproduce whatever the historical decisions got wrong.
So use a lead qualification framework, by all means. Pick the one your reps will actually complete. Then treat the framework choice as settled and spend your remaining governance attention on the threshold, which is where the money is.
The reject-pile audit: what you need before you start
The rest of this article is a procedure. We call it the reject-pile audit, and it has four moves: Record the no. Sample the no. Work the sample. Compare the rates. It is deliberately unclever: the hard part is not the statistics, it is getting an organisation to spend rep hours on leads its own system said were not worth rep hours.
Before you run it, five things need to be true. If any is missing, fix that first, because the audit will produce a number you cannot trust.
1. Rejections are written down as events, not inferred from absence. You need a record that says: this lead, at this timestamp, was scored X by model version Y and routed to the reject path by threshold Z. Check this against your own stack rather than assuming it. A stored score is not the same as a stored decision, and without the model version and the threshold value you cannot tell a change in the funnel from a change in the model.
2. The threshold has a named owner. Somebody must be answerable for the number. Where the cut-off was set during an implementation project by someone who has since left, no living person will claim it, and findings with no owner produce a slide rather than a change.
3. You can draw a genuine random sample from the rejected population. Not the most recent hundred. Not the ones closest to the threshold. Random, across the full reject pile, or your result measures the boundary rather than the pile. Sampling only near-misses is the easiest way this exercise gets quietly defanged, because near-misses should convert better than the pile average whenever the score carries information, so the exercise produces a comforting answer without testing the pile.
4. You have rep capacity you are prepared to spend and not reclaim. The sample must be worked to the same standard as a qualified lead. Half-hearted work on the sample produces low conversion, which confirms the model, which was the outcome the organisation wanted. This is the step where the audit is easiest to compromise, and it gets compromised for human reasons rather than technical ones.
5. Outcomes are recorded identically for both cohorts. Same stages, same definitions, same closed-lost reasons. If sampled leads get a special record type, someone will filter them out of the comparison later.
One more prerequisite that is easy to miss: agree, in advance and in writing, what result would cause you to move the threshold. Pre-committing to the decision rule stops the audit becoming an argument about the number after the number arrives.
The reject-pile audit: the four moves
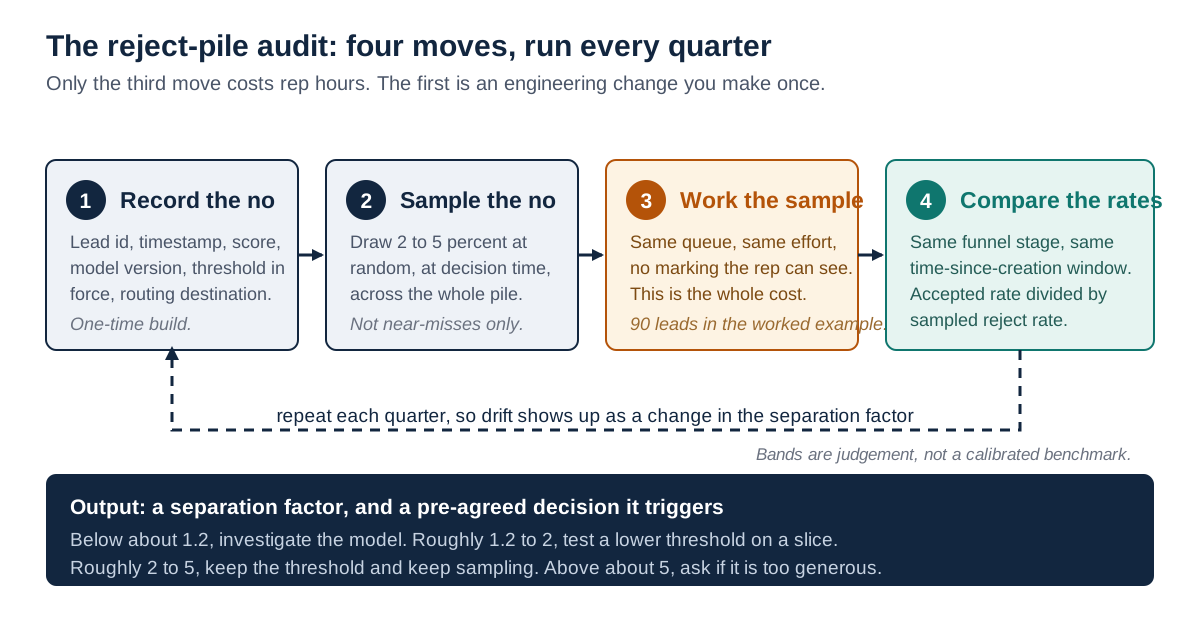
The audit loop. The only expensive move is the third one.
Move 1: Record the no. Every rejection becomes a row: lead id, timestamp, score, model version, threshold in force, routing destination. This is an engineering change you make once, and it is the foundation for everything else. You will wish you had started it two years earlier, because the audit gets more useful the longer its history runs.
Move 2: Sample the no. Draw a random percentage of rejected leads and flag them for working. Scarone and Baeza-Yates report that "even minimal exploration rates (2--5%) prove sufficient in our experiments to diagnose the severity of the feedback loop at near-zero cost," a finding they describe as consistent across two machine learning methods and three real-world datasets. That is a credit-scoring result, not a sales one, and we have not seen it replicated on pipeline data. But it is the only published figure we could find that sizes this trade-off at all, and 2 to 5 percent is a defensible starting rate precisely because it is small enough to survive a budget conversation.
Draw the sample automatically at decision time. A human choosing which rejects to test will choose interesting ones.
Move 3: Work the sample. Route sampled leads into the normal queue with no marking that identifies them as a test to the rep working them. Reps who know a lead is from the audit will work it differently, in one direction or the other, and either way you have measured the rep rather than the lead. Keep the flag in the data warehouse, not on the record the rep sees.
Move 4: Compare the rates. At the end of the period, compute the same outcome rate for both cohorts, at the same funnel stage, over the same window. The ratio between them is your separation factor: how many times better the accepted cohort converts than the rejected one. A separation factor near 1.0 means the model is not distinguishing anything, and you are paying for a filter that could be replaced by a coin. A very high factor means the model is separating well and your threshold may even be too generous.
| Separation factor (accepted rate ÷ sampled reject rate) | What it suggests | Reasonable next step |
|---|---|---|
| Below about 1.2 | The model is barely separating | Investigate the model before touching the threshold |
| Roughly 1.2 to 2 | Real but weak separation | Test a lower threshold on a slice; the reject pile likely holds material revenue |
| Roughly 2 to 5 | Solid separation | Keep the threshold; keep sampling to detect drift |
| Above about 5 | Strong separation | Consider whether the threshold is too generous in the other direction |
Those bands are our judgement, not a measured benchmark, and we have not found published sales-funnel data that would let anyone calibrate them properly. Use them to structure the conversation, not to settle it.
A worked audit, end to end
Here it is assembled on one set of numbers. Every figure in this section is an illustrative assumption, or arithmetic on those assumptions. None is measured data from a real company, ours or anyone else's. Replace four inputs with your own and you have an answer this afternoon.
The setup. A B2B software company receives 4,000 inbound leads in a quarter. The scoring model qualifies 1,000 of them, 25 percent, and rejects 3,000. Of the 1,000 worked, 120 become sales opportunities and 40 close won.
Reported today, that funnel looks like this:
| Cohort | Volume | Opportunities | Opportunity rate | Closed won | Close rate |
|---|---|---|---|---|---|
| Qualified (worked) | 1,000 | 120 | 12.0% | 40 | 4.0% |
| Rejected | 3,000 | Not recorded | Not recorded | Not recorded | Not recorded |
That is the dashboard. It shows a 4.0 percent close rate on qualified leads and nothing about three-quarters of the funnel.
The audit. Sample 3 percent of the reject pile: 90 leads, drawn at random at decision time, routed into the normal queue unmarked. Suppose that over the quarter those 90 produce 5 opportunities and 2 closed-won deals.
| Cohort | Volume | Opportunities | Opportunity rate | Closed won | Close rate |
|---|---|---|---|---|---|
| Qualified | 1,000 | 120 | 12.0% | 40 | 4.0% |
| Rejected, sampled | 90 | 5 | 5.6% | 2 | 2.2% |
| Separation factor | 2.2x | 1.8x |
The reading. The model is separating. Qualified leads convert to opportunity at roughly twice the rate of rejected ones. It is not separating anything like as well as a 4.0 percent headline close rate implies, because the comparison the headline invites you to make is against zero, and the true comparison is against 2.2 percent.
Now extrapolate, carefully. If the 2.2 percent close rate held across the rest of the reject pile, the 2,910 leads nobody worked contain about 65 more winnable deals in the quarter, 67 counting the two the sample already closed, against the 40 the qualified pile actually closed. The reject pile is three times the size at roughly half the rate, so in absolute terms it holds more deals than the pile you are working.
That number is arresting and it is also the most over-read line in this entire exercise, so here are the three things it does not mean.
It does not mean 67 deals are being left on the table. Realising them would require working 3,000 leads instead of 1,000, which is triple the rep capacity, and rep capacity is the constraint the qualification model exists to manage. The right comparison is marginal: what does the next tranche of leads below the threshold convert at, and does that beat the next best use of an hour of rep time?
It does not mean the threshold is wrong. It means the threshold has a price, and now you know roughly what it is. A threshold that discards 67 winnable deals a quarter may still be correct if working them costs more than they are worth. That is a decision a CFO can now make, which is the actual deliverable of this audit. Before the audit, nobody could make it, because the cost of the threshold was not a number, it was a blank.
It does not mean the reject pile is uniform. Leads just below the cut probably convert far better than leads at the bottom, which is why the next iteration stratifies the sample by score band. Stratification is version two of this exercise: you need the flat number first, to know whether repeating it is worth anything.
The decision rule, written before the numbers arrived. Suppose the team pre-committed to: if the opportunity-rate separation factor is below 2.5, test lowering the threshold by one band on a randomised half of the inbound queue for one quarter. At 2.2, that test fires, which is a stricter bar than the general bands above would set. That is allowed: the bands start the conversation, and a team that has decided rep capacity is not its binding constraint may pre-commit to a tighter trigger. What matters is that the number was agreed before the result arrived.
How much the sample can honestly tell you
Two closed-won deals out of 90 is a real result and a very imprecise one, and an audit that pretends otherwise gets demolished by the first analyst who looks at it. Bring the interval yourself.
Using the exact binomial (Clopper-Pearson) method, here is what each of those sample results actually supports. These are computed from the illustrative numbers above, and you can reproduce them in a line of Python or R.
| Measurement | Observed rate | 95% confidence interval | What it can settle |
|---|---|---|---|
| Closed won, 2 of 90 (one quarter) | 2.2% | 0.3% to 7.8% | Nothing: the interval spans the 4.0% qualified rate |
| Closed won, 8 of 360 (four quarters) | 2.2% | 1.0% to 4.3% | Still spans 4.0%; direction only |
| Closed won, 12 of 540 (six quarters) | 2.2% | 1.2% to 3.9% | Clears 4.0%: the first point you can defend the gap |
| Opportunities, 5 of 90 (one quarter) | 5.6% | 1.8% to 12.5% | Nothing: the interval still spans the 12.0% qualified rate |
| Opportunities, 10 of 180 (two quarters) | 5.6% | 2.7% to 10.0% | Clears 12.0%: separation in half a year |
Read the first and fourth rows together, because they are the ones that will save you from overselling your own audit: a single quarter of a 3 percent sample settles nothing at either stage. Both intervals still contain the qualified cohort's rate. Anyone presenting one quarter of this as proof is reading a point estimate and ignoring the width around it.
What the table does support is a choice of metric. Measure at the earliest reliable outcome, not the final one. Opportunity creation happens sooner and more often than closed-won, so its interval tightens faster: here the opportunity comparison clears the qualified rate after two quarters, while the closed-won comparison needs about six. Same sample rate, same funnel, three times the wait for choosing the metric further down.
Pick the earliest stage that a human confirms, that the model was not directly optimised against, and that is recorded consistently. Meeting held is usually better than meeting booked, because booked is gameable and held is not. Opportunity created is usually better still, if your definition of opportunity is disciplined.
This is also the honest boundary of what the published evidence supports. Scarone and Baeza-Yates found 2 to 5 percent exploration sufficient to diagnose the severity of the feedback loop. Diagnosing severity and sizing a revenue opportunity are different jobs, and the small sample does the first one well and the second one badly. If your goal is a board-ready number for lost revenue, you need either a much larger sample or a much longer run, and you should budget for it explicitly rather than discovering it at the readout.
Six ways a reject-pile audit goes wrong
Each has an obvious fix and each is easy to walk into.
Sampling near the threshold instead of across the pile. The easiest failure to walk into, and the most flattering. Leads just below the cut should convert better than the pile average if the score carries any information at all, so a near-miss sample overstates the reject pile's quality and can trigger a threshold change that floods reps with genuinely poor leads. If you want to know about near-misses specifically, that is a separate, stratified study; do not let it stand in for the flat one.
Letting reps know which leads are sampled. A rep who knows a lead is a test either works it harder, to be helpful, or works it less, because the system already said it was junk. Both destroy the measurement. Keep the flag out of the CRM view.
Working the sample worse than the qualified cohort. The sample must get the same sequence, the same number of attempts, the same seniority of rep. Any shortfall shows up as a low conversion rate that reads as a vindication of the model, and an organisation that prefers that conclusion will not go looking for the cause.
Comparing across different time windows. Qualified leads worked in January have had six months to close; sampled rejects worked in June have had one. Compare by time since creation, not calendar date, or you will read a maturity difference as a quality difference.
Retraining the model on the sample and calling it done. Adding worked rejects to the training set does improve the model, and reject inference is a real technique with a real literature. But it is not a substitute for continued sampling. Scarone and Baeza-Yates evaluated exactly these inference methods and found their effectiveness "remains poorly understood", which is why their recommendation is controlled exploration, a procedure that keeps generating fresh unbiased data, rather than a one-off statistical repair. Stop sampling and the blind spot regrows.
Running it once. A single audit tells you about one model version, one threshold and one quarter's lead mix, and as the interval table shows, one quarter settles nothing. The value compounds as a standing quarterly line, because then it detects drift, the failure mode that arrives without anyone changing anything. Treat the sample rate as a small permanent operating cost, like a holdout group in an email programme.
Making the reject pile a governed object
Everything above is a measurement procedure. Turning it into something that survives a reorganisation takes three more decisions, and they are ownership decisions rather than analytical ones.
Give the threshold an owner and a review date. Not the model, the threshold. The model has a vendor or a data team. The number that converts a score into a decision may have neither. Put a name against it and a date in the calendar, and make the reject-pile audit the standing input to that review.
Make the rejection an auditable record. A rejection with a lead id, a timestamp, a model version, a threshold value and a routing destination is an event you can query two years later when someone asks why a company that just signed a seven-figure deal with a competitor was never called. Without the model version and the threshold value, the record cannot answer the question, because you will not be able to reconstruct what the system believed at the time. This is the same argument we have made about proving what an agent actually did: a decision the system cannot reconstruct is a decision nobody can be accountable for.
Decide who may move the number, and log it when they do. Threshold changes are among the highest-leverage edits in a revenue stack and among the least controlled. Check whether anyone with admin rights on the marketing platform can move a cut-off and instantly change how many people get contacted, with no approval and no record. That is an access-control question before it is an analytics one.
| Object | Who should own it | What the control looks like | Review cadence |
|---|---|---|---|
| Scoring model | Data team or vendor | Version pinning; changelog | On each retrain |
| Threshold value | A named revenue leader | Change approval; logged edits | Quarterly |
| Reject-path routing | RevOps | Documented destination per band | Quarterly |
| Sample rate | Same owner as the threshold | Standing budget line | Annual |
| Audit readout | Finance plus revenue leadership | Pre-agreed decision rule | Quarterly |
A note on where this touches law, and where we stop. Scoring and routing people, even in a business-to-business context, sits near rules about profiling and automated decision-making in several jurisdictions, and the answers vary by where your prospects are and what the decision does to them. We are not going to tell you what any of those rules require of you, because that is a question for your counsel with your facts in front of them, not for a blog post. What we will say is that the record-keeping the audit needs, a durable log of what the system decided and on what basis, is the same record-keeping any such conversation with counsel will start from. Build it because it makes the system measurable; you will be glad of it if the other conversation ever happens.
Where a governance layer fits, and where it does not
LeapForce is not a lead scoring product and not a CRM. If you need a qualification model, buy one from the vendors in this category; nothing we build will score a lead for you. What we build is the governed layer underneath the AI systems that make decisions like this one: one controlled endpoint for the models, non-human identities with an owner, a scope and an expiry for every agent that touches your data, and a tamper-evident record of what ran, what it decided and what it was refused. The seam this article keeps arriving at is exactly that: the decision existed, the record did not, and no dashboard could recover it afterwards. Our rollout guidance for that layer is deliberately unglamorous and it applies to a qualification model as readily as to a chatbot: observe first, enforce second, optimize third, because the first useful artifact is not a policy, it is an honest picture of what the system is already deciding on your behalf. One honest caveat, since the disclaimer belongs in the same breath as the claim: the parts of our platform that put budgets and chargeback in dollars against a named owner are in development rather than shipping today, and a governance layer records decisions, it does not make your scoring model more accurate. For the adjacent argument about what happens when a model's output starts allocating money rather than attention, see our earlier analysis of when a customer health score becomes spend, and for the approval mechanics, when a human approval gate is the actual control.
Honest limits on this analysis
Several things here are less certain than the structure makes them look.
We found no sales-funnel evidence base for the core recommendation. The 2 to 5 percent exploration rate, the illusion-of-improvement finding, and the reject-inference literature generally all come from credit scoring, where the outcome is a default event, the population is large, and the decision is regulated. Sales funnels have smaller volumes, fuzzier outcomes, longer horizons and an active human in the loop. We believe the mechanism transfers because it is a property of selective labelling rather than of lending, and the selective-labels paper itself demonstrates the pattern across healthcare, insurance and criminal justice. But we could not find a published sales-pipeline version of it, and if your funnel produces 400 leads a quarter rather than 4,000 the sampling arithmetic in this article will not give you a usable interval in any reasonable time.
We have not run this. No LeapForce team member has run a reject-pile audit on a live pipeline. The procedure is assembled from published research plus arithmetic. A single real readout from a real company would be worth more than the whole of this article, and we do not have one.
Every number in the worked example is invented for illustration. The 4,000 leads, the 25 percent qualification rate, the 12 percent and 4 percent conversion rates and the sample outcomes are assumptions chosen to be plausible and round. They are not benchmarks. Do not quote them as industry figures, and be sceptical of anyone who quotes them back at you.
We deliberately excluded the category's own statistics. The top-ranking guides on this keyword carry figures such as a 20 percent lift in conversion or a 30 percent productivity gain from automated qualification. We traced the ones we could and they resolve to other vendors' blog posts rather than to primary research, so we have not repeated them. Their absence here is a choice, not an oversight.
One major vendor's documentation is unverified. As noted above, Salesforce's Einstein Lead Scoring help page did not render to our tooling, so the article draws its platform evidence from HubSpot only. A reader on Salesforce should assume nothing here describes their product specifically.
The separation-factor bands are judgement. The table earlier suggesting what a factor below 1.2 or above 5 means is our reasoning about what the arithmetic implies, not a calibrated benchmark from a dataset. Treat it as a way to structure the discussion.
The audit measures the model, not the market. A reject-pile audit tells you whether your threshold is discarding winnable deals given how your reps currently sell. It will not tell you that an entire segment is winnable with a different pitch, a different price or a different product. That is a strategy question and this is a measurement instrument.
Frequently asked questions
Automated lead qualification is software that decides which prospects a human contacts. It typically combines enrichment data, a scoring model and a routing rule: leads scoring above a threshold reach a sales rep, and leads below it go to nurture, self-serve or nowhere. The distinguishing feature is that it allocates a scarce resource, rep attention, rather than merely describing a lead. Most of its output is rejection, since a system that qualified most of the queue would not be saving anyone any time.
You cannot know from your own reporting, and that is the honest answer. Platform analytics compute conversion rates for the leads an AI lead qualification model accepted, which measures precision on a self-selected cohort. The leads it rejected have no recorded outcome, so overall accuracy has an unmeasured term in it. This is the selective labels problem described by Lakkaraju and colleagues at KDD 2017: the instances with observed outcomes are not a random sample of the population. The only way to get a real accuracy estimate is to work a random sample of rejected leads and compare.
Sample and work them. Draw a random 2 to 5 percent of rejected leads at decision time, route them into the normal queue without telling reps they are a test, and compare their conversion rate at a mid-funnel stage against the accepted cohort's. The ratio between the two rates is your separation factor. If it is close to 1.0 the model is not distinguishing much; if it is high the model is separating well. Nothing computed from accepted leads alone can answer this question, because the comparison group does not exist in your data.
Two to five percent is a defensible starting point. In credit-scoring experiments, Scarone and Baeza-Yates report that "even minimal exploration rates (2--5%) prove sufficient in our experiments to diagnose the severity of the feedback loop at near-zero cost," a result they describe as holding across two machine learning methods and three real-world datasets. That result is from lending rather than sales, so treat it as a starting rate rather than a proven one. The practical constraint is usually not statistics but rep hours: a 3 percent sample on 3,000 rejections is 90 extra leads a quarter, which is a small enough number to get approved and large enough to show direction.
For the problem in this article, neither, because the choice does not affect it. BANT and CHAMP are both lead qualification frameworks that structure what you ask a prospect; they say nothing about where the accept/reject cut-off sits or what happens to the leads below it. Pick whichever your reps will complete consistently, since a half-filled framework produces worse data than a simpler one filled in properly. Then spend your governance attention on the threshold, the routing of the reject path, and whether anyone is measuring it.
Longer than one quarter, whichever outcome you pick. With the illustrative numbers in this article, a single quarter of a 3 percent sample produces intervals that still contain the qualified cohort's rate at both stages, so it settles nothing. Accumulating the sample, the opportunity-rate comparison clears the qualified rate after about two quarters and the closed-won comparison after about six. So measure at the earliest stage a human confirms, that the model was not optimised against, and that your team records consistently, and budget for a year rather than a quarter before the answer is defensible.
Yes, and often more sharply. In outbound, a scoring or fit model decides which accounts and contacts enter a sequence at all, so the rejected population is never contacted by anyone and generates no signal whatsoever. Inbound at least leaves rejected leads in the database where some will convert through a self-serve path on their own, which gives you a partial, biased view of the reject pile for free. Outbound gives you nothing, which makes deliberate sampling the only available instrument.
Split it. The model itself usually belongs to a data team or the CRM vendor, and its controls are version pinning and a changelog. The threshold, which is where the business decision lives, needs a named revenue leader who is answerable for it, a change-approval step, and a logged edit history. Where the threshold has no owner at all, because it was set once during implementation and never revisited, the highest-leverage number in the funnel is unmanaged. Assigning it is usually the cheapest improvement available.
The recurring cost is rep hours on leads your system said were not worth rep hours, and that is the number to put in front of a decision-maker honestly. Using this article's illustrative funnel, a 3 percent sample of 3,000 quarterly rejections is 90 additional leads worked per quarter, roughly 9 percent on top of the 1,000 qualified leads the team already works. There is also a one-time engineering cost to log rejections as events with model version and threshold, which is a build rather than a setting in the platform documentation we were able to read. Against that, the output is the first real estimate of what your threshold costs, which nothing else in the stack can produce.
Explanations are useful for debugging and are not a substitute for outcome data. Some platforms are explicit about the limit: HubSpot's documentation says it uses "blackbox machine learning to provide predictions," where the inputs and outputs are known but how one becomes the other is not. Even with a fully interpretable model, an explanation tells you what the model weighted, not whether the weighting was right. Only an observed outcome for a rejected lead can tell you that, and observing it requires working the lead.
It can be, and the answer depends on your jurisdiction, your prospects' location and what the decision does to the person scored, so it is a question for your counsel rather than for an article. What we will say is operational: the evidence any such conversation needs is a durable record of what the system decided and on what basis, including the model version and the threshold in force at the time. If your qualification stack does not keep that record today, building it is worth doing for measurement reasons alone, and it is the same artifact you would need if the compliance question ever arrives.
Ready to Govern Your AI?
Talk to LeapForce — one controlled layer for every AI tool, connector, model, and agent.
Comments