
Build your delegation matrix on two axes: how long it takes to check the finished work versus how long it takes to do it yourself, and whether a wrong result announces itself or slips through quietly. Hand off first the tasks you can verify in under half the time they take to perform, and whose failures are loud. Everything else waits.
That is not the delegation matrix most people are taught. The standard version plots business value against personal energy drain, which tells you which tasks you resent and which ones matter. Useful for a career conversation. Useless for a handoff decision. Our position is that value and energy are the wrong pair, because neither of them predicts the thing that actually determines whether delegation saves time: what it costs you to know the work came back right. On Hacker News in December 2025, a developer pushed back on a colleague who claimed to write only 5% of the code they ship, asking whether the audit was really cheaper. The skill that mattered, they wrote, was predicting "whether reviewing/correcting the output for each increment will take longer than just doing it myself" (MontyCarloHall, Hacker News). That is the delegation question, stated exactly, and no popular matrix has a column for it.
The short answer: Score every task on effective check ratio (verification time plus sampling and rework, divided by do-time) and failure visibility; delegate the ones at or under 0.45 with loud failures now, instrument the silent ones before you delegate them, split or keep the rest.
Last updated: July 30, 2026.
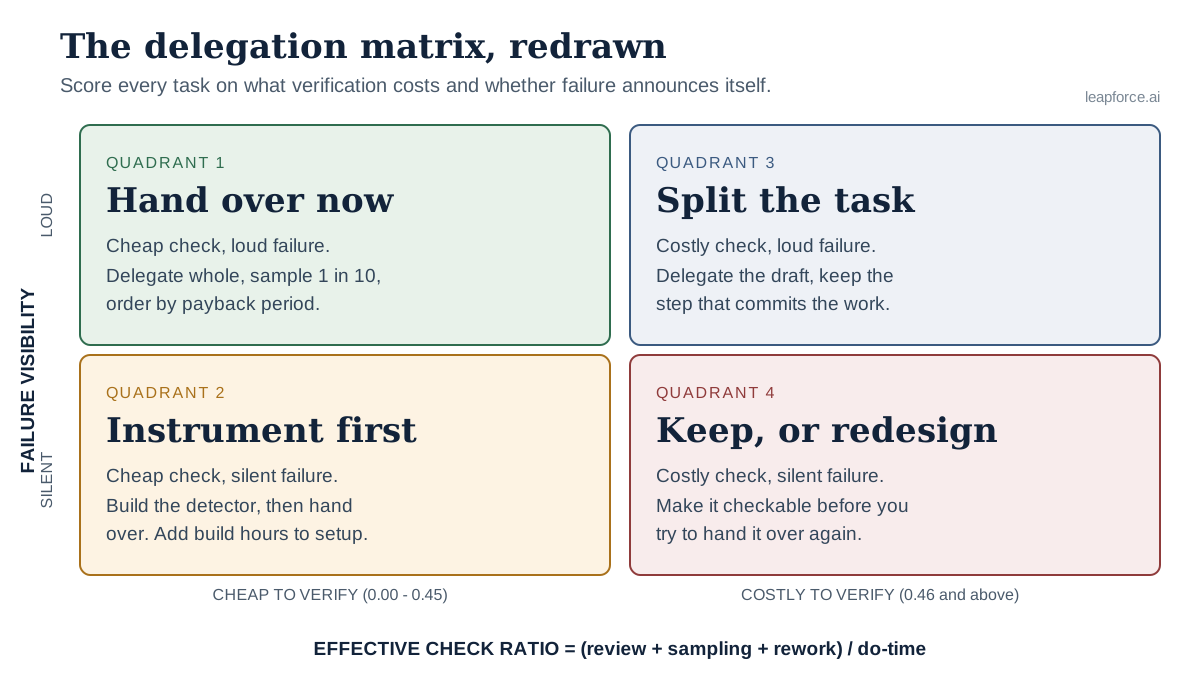
The delegation matrix redrawn: verification cost on one axis, failure visibility on the other.
What a Delegation Matrix Is, and Why the Usual Axes Mislead
A delegation matrix is a grid that sorts your tasks into handoff decisions by scoring each one on two properties, so that "what should I let go of" becomes arithmetic instead of instinct. The common versions score importance against urgency, or business value against the energy a task drains from you. Both produce a tidy picture. Neither survives contact with the moment you actually hand something over.
The energy-versus-value grid answers a question about you. It sorts tasks by how much you enjoy them and how much they move the business, and it reliably concludes that you should delegate the draining, low-value work. Fine. But the tasks that drain you are frequently the ones that are hardest to specify, because they drain you precisely because they are fiddly, exception-laden and full of unwritten judgement. Handing those off first is how delegation gets a bad reputation: the work comes back wrong, you rewrite it, and you conclude that nobody can do it but you.
Delegation is not the problem. Gallup studied 143 chief executives on the 2014 Inc. 500 list and found that those with high Delegator talent generated 33% more revenue in 2013 than those with limited or low Delegator talent ($8 million against $6 million), and posted an average three-year growth rate of 1,751%, 112 percentage points ahead of the low delegators (Gallup). In the same research Gallup reported that 75% of the employer entrepreneurs it studied have limited-to-low Delegator talent. The payoff is well evidenced; the sequencing is where people fail.
The failure the usual axes cannot see
Here is the case the value-versus-energy grid gets structurally wrong. Take a task you find dull and that carries modest business value — coding vendor invoices to the right general-ledger accounts, say. Classic matrix: delegate immediately. Now add the fact that a miscoded invoice looks completely normal until the quarterly close, three months later, when someone reconciles the accounts and finds a variance nobody can explain. The task was cheap to hand over and expensive to trust. The matrix had no column for that, so it recommended the handoff anyway.
Now take the mirror image. A task you enjoy that is also high value: writing the customer-facing pricing-change email. Classic matrix says keep it. But a bad draft of that email is caught instantly, by legal, by your CEO, by anyone who reads it before it ships. The check is fast because the failure is loud. It is a much safer handoff than the invoice coding, and the standard delegation matrix ranks it last.
That inversion is the whole argument of this article, and it is why we treat check cost as the primary sort in any delegation framework rather than a detail to handle later. The two properties that decide whether a handoff works are how expensive verification is and how visible failure is. Value and energy are downstream considerations — they help you choose between two tasks that both pass, and they are useless as the primary filter.
The Two Axes That Actually Predict a Clean Handoff
Score each task on two things. Check ratio is the time to verify a finished output divided by the time it would take you to produce it yourself. Failure visibility is whether a wrong output announces itself before it reaches someone who matters. Both are measurable in an afternoon, and neither requires you to guess at business value.
Axis one: the effective check ratio
The naive version of check ratio is simply check time ÷ do-time. A four-minute review of a task that takes you twenty minutes gives 0.20. That number is optimistic, because reviewing an output is not the whole verification cost. Two things get added.
The first is sampling. If a delegated task runs a hundred times a month, you are not going to review a hundred outputs forever, and you should not pretend otherwise. Realistic practice is a spot-check: fully re-perform a sample of outputs, independently, and compare. If you re-do one in ten, you have added 10% of the do-time to every single run's verification budget.
The second is expected rework: the share of outputs that come back wrong and have to be corrected, multiplied by what correction costs. If one in twenty drafts needs a five-minute fix, that is 0.25 minutes per run.
So the number to score is:
Effective check ratio = (review time + sampling surcharge + expected rework) ÷ do-time
That formula is the whole framework. Everything downstream is thresholds and sequencing. The sampling surcharge is what makes the arithmetic honest, because it is the term that punishes exactly the tasks where you would otherwise be tempted to skip verification entirely.
Axis two: failure visibility
Failure visibility asks a narrower question than risk. It is not "how bad would it be" — that is blast radius, and we have written about ranking work by blast radius rather than department elsewhere. Visibility asks: if this output is wrong, does anything downstream complain?
A loud failure is one where a wrong result trips something: a validation rule rejects it, a total does not reconcile, a customer replies asking what you mean, a build fails, an approval queue flags it. A silent failure is one where the wrong result is indistinguishable, on inspection, from the right one: a plausible-sounding policy statement that happens to be false, a GL code that is valid but wrong, a summary that omits the one paragraph that mattered.
Silent failure is the property that makes AI delegation different in kind from human delegation, and it is now measured. Stack Overflow's 2025 Developer Survey of over 49,000 respondents found the single largest AI frustration, cited by 66% of developers, was "AI solutions that are almost right, but not quite," with 45.2% naming the fact that debugging AI-generated code takes more time (Stack Overflow). Almost-right is the definition of a silent failure. The same survey found only 3.1% of developers highly trust the accuracy of AI output, while 84% use or plan to use the tools — a gap that only makes sense if people are absorbing a verification cost they have not priced.
Scoring both axes without a research project
Failure visibility is a binary you can usually settle in fifteen seconds: name the mechanism that would catch a wrong output before it reaches a customer, an auditor or the general ledger. If you can name it, the task is loud. If your answer is "I'd probably notice", it is silent: "I'd probably notice" is not a mechanism, it is a hope, and the next section explains why it decays.
Check ratio takes longer but not much. Pick five real instances of the task from the last month, time yourself doing one end to end, then time yourself reviewing a finished one you did not produce. Two data points beat a guess, and the number only needs to be accurate enough to put the task in the right band.
Prerequisites: What You Need Before You Draw Anything
Four things have to exist before the delegation matrix is worth drawing: a real task list rather than a remembered one, one timed instance of each task, a named person who can approve the handoff, and a decision about who or what the delegate is. Missing any of them and you will produce a pretty grid that changes nothing.
| Prerequisite | What "done" looks like | Typical time |
|---|---|---|
| A task list from observation, not memory | Two weeks of logged work, each entry with a trigger and an input | 10 min/day for 10 working days |
| One timed instance per candidate task | A stopwatch number, not an estimate | 1-2 hours total |
| One timed review per candidate task | You verify an instance you did not produce | 1-2 hours total |
| A named approver | The person who can say yes to the handoff and owns the outcome | one conversation |
| A named delegate | A specific person, a role, or a specific agent — never "the team" | one decision |
The first row is the one people skip, and it is the one that determines whether the rest is fiction. Memory over-weights the tasks you disliked most recently and drops the twenty small ones that consume the afternoon. We have set out the logging method in detail in our earlier analysis of the two-week ledger for repetitive work; this article picks up where the ledger ends, so if you have not logged anything yet, log first and come back.
One honest note about the numbers in this article: we have not run a controlled internal trial of this delegation matrix and we are not going to present one. Every figure in the worked sheet below is illustrative and clearly labelled as such. The research we cite is external, named and linked. Where the field has measured something — verification time, automation bias rates, project cancellation rates — we use the measurement. Where it has not, we say so rather than inventing a case study.
How to Build the Delegation Matrix in Six Steps
Six steps, roughly two to three hours once the ledger exists. Steps one through three produce the raw numbers, step four produces the grid, and steps five and six turn the grid into a sequence you can actually start on Monday.
Step 1 — Shortlist candidates. From your logged task list, keep only tasks that recur. A one-off is not a delegation candidate; it is a favour to ask. Recurrence is what amortises setup cost, and setup cost is what kills most handoffs. Twelve to twenty candidates is a workable shortlist.
Step 2: Time the do. For each candidate, time one real instance end to end, including the gathering-and-context part that people forget to count. Record minutes, not "about half an hour".
Step 3, Time the check. Have someone else, or a tool — produce one instance, then time yourself verifying it to the standard you would actually accept before it goes out. This is the number nobody has, and it is the one the whole delegation matrix turns on. Be strict: verifying means confirming the output is correct, not skimming it for obvious nonsense.
There is an obvious circularity here — you need a check time to decide whether to delegate, and you need to have delegated to get a check time. Three ways out, in descending order of fidelity. Ask a colleague to produce one instance as a favour and time your review of it. Run one instance through the tool or agent you are considering, as a trial, and review that. Or take one of your own outputs from more than two weeks ago, which you no longer remember producing, and verify it cold. The third is the weakest because you unconsciously trust your own work, so inflate the result by roughly a third before using it. Any of the three beats an estimate.
Step 4: Compute the effective check ratio. Add the sampling surcharge (your planned spot-check rate multiplied by do-time) and expected rework (failure rate multiplied by correction time) to the review time, then divide by do-time. Round to two decimals.
Step 5 — Set failure visibility. For each task, write down in one line the mechanism that would catch a wrong output. Mechanism named: loud. No mechanism: silent. Do not negotiate with yourself on this step.
Step 6: Plot and sequence. Place each task on the grid, take the verdict for its quadrant, then order within the "hand over" quadrant by monthly hours reclaimed net of upkeep, and check the payback period before you commit. The sequencing rule is in its own section below, because getting the order wrong is a distinct failure from getting the quadrant wrong.
The three bands
| Effective check ratio | Band | Meaning |
|---|---|---|
| 0.00 - 0.30 | Free to verify | Verification is a rounding error against the work saved; no further debate needed |
| 0.31 - 0.45 | Cheap to verify | Still clearly worth handing over; watch the upkeep line |
| 0.46 - 0.99 | Costly to verify | Most of the saving is consumed by checking; delegate only the separable parts |
| 1.00 and above | Hard stop | Checking costs more than doing. Do not delegate this shape of task |
The 0.45 line is the axis boundary. Anything at or below it counts as cheap-to-verify for the purposes of the grid; anything above it counts as costly. The finer bands tell you how much argument the decision deserves, not which quadrant the task is in.
The hard stop deserves emphasis because it is counter-intuitive and it is where the "just delegate the things you hate" advice does real damage. A task can be genuinely awful to perform and still fail the arithmetic. Reading code is the canonical example: several practitioners argue reading is harder than writing, which is why an audit-everything workflow can consume the entire gain. When the ratio crosses 1, delegation is not a time strategy, it is a preference — sometimes a legitimate one, but you should know which you are buying.
The Worked Sheet: Ten Tasks Scored End to End
Below is a complete, filled delegation matrix worksheet for a hypothetical 40-person B2B software company's operations lead. Every number here is illustrative: invented for the worked example, not measured by us. The point is the arithmetic and the shape of the conclusions, both of which you can reproduce with your own timings.
Assumptions used throughout: a spot-check rate of 1 in 10 (so the sampling surcharge is 0.10 x do-time), and an assumed rework term folded into the review column where stated.
| # | Task | Runs/month | Do-time (min) | Review (min) | Sampling (min) | Effective ratio | Failure | Quadrant |
|---|---|---|---|---|---|---|---|---|
| 1 | Weekly board-metrics pull from three dashboards | 4 | 45 | 6 | 4.5 | 0.23 | Loud | Hand over |
| 2 | First-draft replies to inbound support email | 200 | 6 | 2 | 0.6 | 0.43 | Silent | Instrument first |
| 3 | Vendor invoice coding to GL accounts | 120 | 3 | 1 | 0.3 | 0.43 | Silent | Instrument first |
| 4 | Candidate screening against a scorecard | 60 | 12 | 9 | 1.2 | 0.85 | Silent | Keep |
| 5 | Meeting scheduling across time zones | 40 | 8 | 1 | 0.8 | 0.23 | Loud | Hand over |
| 6 | Monthly churn narrative for the exec deck | 1 | 120 | 70 | 12 | 0.68 | Silent | Keep |
| 7 | Renewal-quote assembly from CRM and price book | 30 | 25 | 5 | 2.5 | 0.30 | Loud | Hand over |
| 8 | Security-questionnaire responses | 8 | 90 | 60 | 9 | 0.77 | Silent | Keep |
| 9 | Expense-report policy checks | 150 | 4 | 1 | 0.4 | 0.35 | Loud | Hand over |
| 10 | Quarterly pricing-change email to customers | 0.33 | 150 | 75 | 15 | 0.60 | Loud | Split |
Reading the sheet
Four tasks land in "hand over", and they are not the four a value-versus-energy grid would have picked. Meeting scheduling (row 5) is low-status, low-value work, and it scores 0.23 with a loud failure — a double-booked calendar complains within the hour. Renewal-quote assembly (row 7) is higher value and higher stakes, and it also scores 0.30 with a loud failure, because the quote validation rules reject a malformed quote before it reaches a customer. Both are excellent first handoffs for opposite reasons.
Candidate screening (row 4) is the trap. It is time-consuming, most people dislike it, and it is exactly the task a conventional delegation matrix pushes to the top of the list. Its effective ratio is 0.85, and its failures are silent: a good candidate wrongly screened out generates no signal at all. Nobody complains, no rule trips, and the cost surfaces six months later as an unfilled role. That is the single clearest example of why verification cost has to be the primary axis.
The payback arithmetic
Sorting by quadrant tells you what is eligible. Payback tells you what to start. Monthly gross saving is runs x (do-time - review - sampling) / 60, in hours:
| Task | Gross saving (h/month) | Setup (h) | Upkeep (h/month) | Net (h/month) | Payback |
|---|---|---|---|---|---|
| 5 - Meeting scheduling | 4.1 | 6 | 0.5 | 3.6 | 1.7 months |
| 7 - Renewal-quote assembly | 8.8 | 20 | 1.5 | 7.3 | 2.7 months |
| 9 - Expense-report policy checks | 6.5 | 12 | 1.0 | 5.5 | 2.2 months |
| 1 - Board-metrics pull | 2.3 | 14 | 1.0 | 1.3 | 10.8 months |
Row 1 is the useful result. The board-metrics pull passes the quadrant test cleanly — cheap to check, loud failure — and still should not be your first project, because three dashboards that change layout every quarter give it a fourteen-hour build and a ten-month payback. It will be re-broken before it pays for itself. A delegation matrix that only sorts by quadrant would have put it near the front of the queue.
Across rows 5, 7 and 9 the three viable handoffs return 16.4 hours a month net, or roughly 197 hours a year, against 38 hours of setup. That is a defensible business case and it is also a modest one: two working days a month, not the transformation the category markets. Worth saying plainly, because the gap between those two numbers is where most delegation programmes lose credibility. The first wave is a proof that the method works, not the return; the return comes from running the same delegation framework across a team, where the per-person setup is paid once and the saving is multiplied by headcount.
One thing this table deliberately does not include: the cost of the delegate. Every hour above is your hour. Before signing off, add the contractor rate, the salary fraction, or the per-run inference and tooling cost of the agent, and check the payback again in money. Break-even in hours and break-even in dollars are different numbers, and for high-frequency, low-do-time tasks — rows 2 and 3, at hundreds of runs a month — the money version is the one that decides.
The Four Quadrants and the Verdict for Each
Each quadrant of the delegation matrix carries one instruction, and the instruction is not always "delegate" or "don't". Two of the four are conditional: they tell you to change the task before you hand it over, which is the move most delegation advice skips entirely.
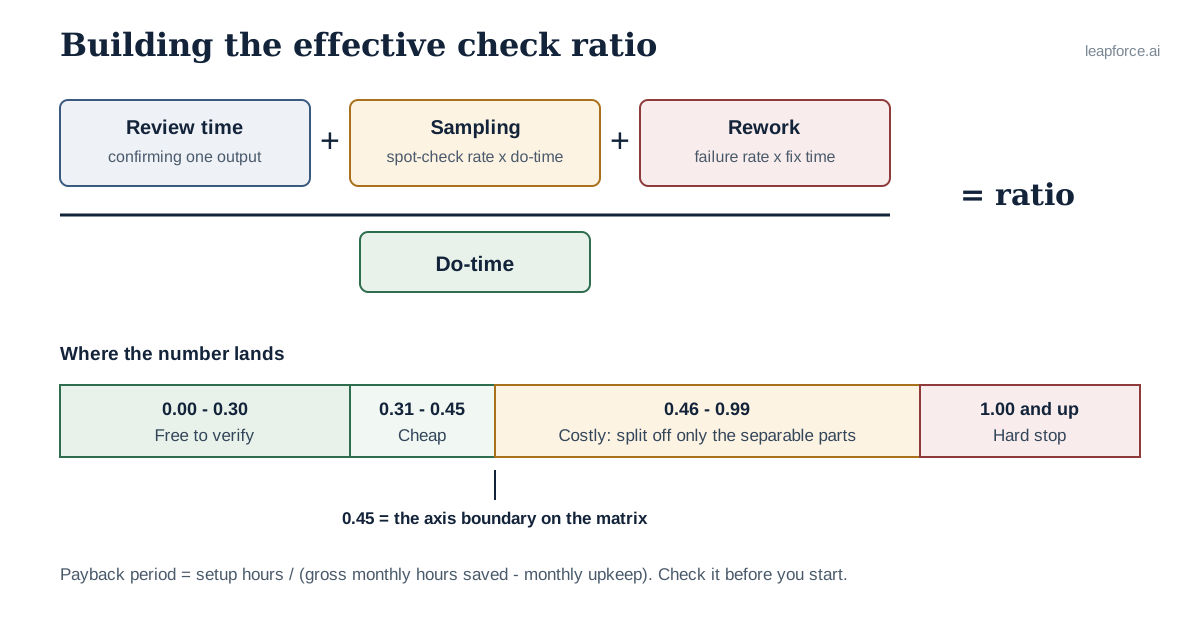
How the effective check ratio is built and where the thresholds fall.
Quadrant 1 — Cheap check, loud failure: hand over now
Choose this if: the effective ratio is 0.45 or below and you can name the mechanism that catches a bad output.
These are your first handoffs regardless of how important or how annoying they are. The verification is cheap and the environment is doing part of your quality control for you. Delegate the whole task, not a fragment of it, and set the spot-check rate you assumed in your arithmetic — if you scored the task at a 1-in-10 sample, actually sample 1 in 10, because the ratio you computed is only true if you do.
The one thing that still kills these is setup cost, which is why the payback table exists. A 0.23 ratio on a task that runs four times a month and takes fourteen hours to automate is a bad project with a good score.
Quadrant 2 — Cheap check, silent failure: instrument, then hand over
Choose this if: the ratio is at or below 0.45 but you cannot name a mechanism that would catch a wrong output.
Do not hand these over yet, and do not keep them either. Build the detector first. The detector is usually cheaper than people expect because you are not trying to catch every error — you are trying to make errors audible. Concretely: a reconciliation that runs at the end of the batch, a confidence threshold that routes uncertain items to a human queue, a rule that flags any output outside the historical distribution, a required citation for every factual claim.
Invoice coding is the standard example. On its own, a wrong GL code is silent. Add a rule that any coding decision below a confidence threshold, or any vendor coded to a new account for the first time, lands in a review queue, and the failure becomes loud for the small subset that matters. The task moves to quadrant 1 and the handoff is now safe. That instrumentation step is what separates a delegation programme that survives its first quarter from one that gets quietly rolled back.
Instrumentation is not free, and it should not be treated as a footnote. Add the build hours to the setup column and re-run the payback arithmetic before committing: a detector that takes fifteen hours to build on a task saving two hours a month has just failed the same test the board-metrics pull failed. Whoever owns the detector also owns keeping it calibrated, which belongs in the upkeep column. If nobody has capacity to do either, the task stays in quadrant 2 rather than being promoted on optimism.
Quadrant 3 — Costly check, loud failure: split the task
Choose this if: the ratio is above 0.45 but a wrong output would be caught.
Split the work at the seam between production and commitment. Delegate the drafting, the gathering, the assembly, the first pass, keep the step where the output becomes real. The quarterly pricing email in the worked sheet is exactly this shape: 150 minutes to write, 75 minutes to review properly, and it is read by legal and the CEO before it ships. Handing over the research, the customer segmentation and the first draft removes most of the 150 minutes without touching the 75.
The seam matters more than the split ratio. We have argued at more length that the control point in an automated process is the commit step, not the whole workflow — the moment the work becomes irreversible or visible to someone outside the team. Draw the line there.
Quadrant 4 — Costly check, silent failure: keep it, or redesign it
Choose this if: the ratio is above 0.45 and no mechanism catches a wrong output.
Keep it. Not forever, and not because it is precious — because the arithmetic says delegation costs more than it saves, and because the failure mode is the one you will not detect until it has compounded. Candidate screening, the security questionnaire and the churn narrative all sit here in the worked sheet.
The escape route is redesign, not willpower. Every quadrant-4 task can move if you change one of the two axes. Give the screening scorecard objective, checkable criteria and the review time drops. Require the churn narrative to cite the specific accounts and numbers behind each claim and its failures become loud, because a cited claim can be checked in seconds. Redesign is a real project; treat it as one rather than pretending the task is un-delegatable.
What to Delegate First: Sequencing After the Matrix
The question of what to delegate first has a boring answer: sequence the "hand over" quadrant by setup hours divided by net monthly hours, the payback period, not by how much you dislike the task or how much value it carries. The fastest-payback handoff funds the next one, both in time and in organisational credibility.
The reason this matters more than it sounds: the first delegated task is not really about the hours. It is the proof that the process works, and it is the one everybody watches. A first project with a ten-month payback and a brittle dependency is how a delegation initiative gets cancelled in month three with the words "it didn't save us anything".
| Sequencing rule | What it prevents |
|---|---|
| Order by payback period, shortest first | A flagship first project that breaks before it pays back |
| Cap the first wave at three tasks | Verification load arriving faster than you can absorb it |
| Require a named owner per task before starting | Orphaned handoffs nobody re-checks after week two |
| Re-time the check after four weeks of real running | Ratios computed on a best-case first instance |
| Stop adding until the previous wave's upkeep is stable | Compounding upkeep that quietly consumes the saving |
The fourth row is the one that gets skipped. Your check ratio was measured on a careful, early instance. Four weeks in, the delegate has drifted into edge cases, the review takes longer than it did, and the ratio is no longer what you scored. Re-time it. If it has crossed 0.45, the task has changed quadrant and you should act on that rather than absorbing the difference silently.
Why "delegate what you hate" is bad sequencing
Tasks you hate are disproportionately tasks with high tacit content. You hate them because they are exception-ridden, because they require holding six unwritten rules in mind, because the inputs are messy. Those same properties make the specification long, the setup expensive and the review slow. That is not an argument for suffering: it is an argument for handling them second, after the cheap wins have bought you the time and the goodwill to do the redesign work properly.
Delegating to a Person Versus Delegating to an Agent
The delegation matrix works for both, but three columns behave differently when the delegate is software rather than a colleague. This is the part that most inherited advice gets wrong: delegating tasks to AI agents is treated as delegation with a faster worker, when the economics of verification are the thing that actually changed. A person's check ratio falls over time as they learn; an agent's does not, unless you change something. A person tells you when they are unsure; an agent produces a confident answer at the same register whether it is right or wrong. And a person handles ten tasks an hour while an agent handles a thousand, which multiplies whatever the error rate turns out to be.
| Property | Human delegate | AI agent delegate |
|---|---|---|
| Check ratio over time | Falls as trust and competence build | Flat until you change the prompt, the tools or the model |
| Signals uncertainty | Usually, and unprompted | Only if the system is built to surface it |
| Failure register | Visible hesitation, questions, escalation | Fluent and confident regardless of correctness |
| Throughput | Bounded by hours | Bounded by rate limits and budget |
| Setup cost | Onboarding conversation, a few reviews | Specification, tool scoping, evaluation, monitoring |
| What survives departure | Little, unless documented | Everything, if the agent is owned by the company rather than a person |
The flat check ratio is the important row. With a new hire, the honest expectation is that months one and two are expensive and month six is cheap, so you tolerate a 0.7 ratio at the start. With an agent, a 0.7 ratio on Monday is still 0.7 in October unless somebody does work to change it. Applying human-delegation intuitions to an agent, "it'll get better as it settles in", is how organisations end up permanently paying a verification tax they budgeted as temporary.
What the productivity research actually shows
The most-cited measurement here is worth reading carefully, including its retraction of confidence. METR ran a randomised controlled trial with 16 experienced open-source developers across 246 real issues and found that when developers were allowed to use AI tools they took 19% longer to complete issues — while those same developers estimated afterwards that AI had sped them up by 20%, having forecast a 24% speedup beforehand (METR).
The data-currency point matters more than the headline. METR re-ran the design with late-2025 tools and published an update on 24 February 2026. Its raw results "show some evidence for speedup": for developers who took part in both studies the estimate moved to -18% on task completion time, meaning 18% faster, with a confidence interval from -38% to +9%; among newly recruited developers the estimate was -4% (-15% to +9%). METR also reported that "30% to 50% of developers told us that they were choosing not to submit some tasks because they did not want to do them without AI," judged the resulting selection effects severe enough that the data gives "an unreliable signal of the current productivity effect," and is rebuilding the design (METR). So: the 19% slowdown was real for early-2025 tools, the direction has since moved toward speedup, the confidence intervals cross zero in both directions, and anyone quoting the 2025 headline as the settled state of the world in mid-2026 is out of date.
What survives both editions is the gap between perceived and measured throughput. That gap is exactly the quantity a delegation matrix built on check ratio is designed to close, because it forces you to put a stopwatch on the part of the work people habitually estimate rather than measure.
The rework tax has a number now
BetterUp Labs and Stanford Social Media Lab surveyed 1,150 full-time US desk workers in September 2025 and found 40% had received "workslop", AI-generated output that looks like work but does not advance the task, in the previous month, with an average of two hours to resolve each incident, a cost they put at $186 per employee per month and $9 million a year for a 10,000-person company (BetterUp Labs).
Two hours per incident is the rework term in the effective check ratio, measured in the wild. It is also a good argument for the instrument-first rule: workslop is by definition a silent failure, since output that obviously failed would have been rejected rather than forwarded.
Why the Check Column Decays: Vigilance and Automation Bias
The check ratio you measured on day one is the best it will ever be, for reasons that were documented forty years before anyone delegated anything to a language model. Human review of a mostly-correct automated process degrades predictably, and it degrades fastest exactly where the failures are rarest. That is why the delegation matrix treats "I'll review it" as a cost with an expiry date rather than a control.
Lisanne Bainbridge set this out in Ironies of Automation (Automatica, Vol. 19, No. 6, 1983). Citing vigilance research going back to Mackworth in 1950, she wrote that it is impossible for even a highly motivated person to maintain effective visual attention on a source where very little happens "for more than about half an hour" (Bainbridge, 1983). Her sharper point lands directly on delegation: the automatic system was installed because it does the job better than the operator, and yet the operator is asked to confirm it is working. Where the automated decision cannot be re-derived in real time, she concluded, "the human monitor has been given an impossible task."
Substitute "reviewer" for "operator" and that is the design of most AI delegation as currently practised.
Automation bias is measured, not theoretical
The second decay mechanism is that reviewers do not merely miss errors, they are actively pulled toward accepting them. A systematic review of automation bias by Kate Goddard, Abdul Roudsari and Jeremy Wyatt in the Journal of the American Medical Informatics Association pooled four healthcare studies of erroneous automated advice and found a risk ratio of 1.26, when the decision-support system was wrong, "the CDSS increased the risk of an incorrect decision being made by 26%" (Goddard et al., JAMIA). Four studies measuring "negative consultations", where a clinician's correct pre-advice decision was reversed to an incorrect one after seeing the automated recommendation, reported rates between 6% and 11%.
Those are trained professionals, in a high-stakes domain, with the automated output clearly labelled. The reviewer is not a neutral filter that passes correct work and stops incorrect work. The reviewer is a component with its own error rate, and that error rate goes up when the thing being reviewed is usually right.
Regulators have started to encode this. The EU AI Act's Article 14 on human oversight requires that people overseeing a high-risk system be enabled to "remain aware of the possible tendency of automatically relying or over-relying on the output," to correctly interpret the output, to decide not to use the system or to "disregard, override or reverse" it, and to interrupt it through a stop button or equivalent (EU AI Act, Article 14). Note what that list implies: oversight is a designed capability with specific affordances, not a person promising to pay attention.
What this changes in the matrix
Three practical consequences, all of which are already baked into the scoring rules above.
First, the sampling surcharge is not optional accounting conservatism — it is the only term that reflects the fact that continuous review does not happen. Second, quadrant 2 exists because building a detector converts a monitoring problem, which humans are demonstrably bad at, into an alerting problem, which machines are good at. Third, re-timing the check after four weeks catches the decay before it becomes a surprise.
The general form of the rule: do not use a human as a sensor for a rare, silent event. Use a human to decide what to do about an event a machine has already flagged. That is also, not coincidentally, the difference between an approval gate that provides real control and one that becomes a rubber stamp, which we have written about in our analysis of when approval actually is control.
Seven Delegation Mistakes That Show Up in the Check Column
Every one of these is diagnosable from the check column of your own delegation matrix, which is the point: mistakes in delegation do not show up as dramatic failures, they show up as a verification cost you never budgeted.
1. Delegating the task without delegating the inputs. The delegate can produce the output but has to come back to you for the context each time. Your review time looks fine; your interrupt cost is invisible and enormous. Fix: score the handoff including the questions it generates in week one.
2. Estimating check time instead of measuring it. Almost universal, and it biases in one direction only. People estimate review at roughly the time it takes to read the output, which is not the same as the time it takes to confirm the output is right. Fix: time one real verification, to the standard you would actually accept.
3. Confusing "I would notice" with a detection mechanism. Covered above at length. If your detection story has no artifact — no rule, no reconciliation, no queue, no alert — the failure is silent, and the task belongs in quadrant 2 until you build one.
4. Delegating a decision when you meant to delegate a draft. The seam between drafting and committing is where most costly-check tasks split cleanly. Handing over both halves at once turns a 0.6-ratio task that could have been usefully split into a full quadrant-4 keep.
5. Setting the spot-check rate and then not doing it. Your effective ratio assumed a 1-in-10 sample. If you sample nothing, you have not saved the sampling time, you have converted a measured cost into an unmeasured risk. Either sample, or re-score the task honestly with the sampling term at zero and the rework term much higher.
6. Delegating once instead of building a standing arrangement. A one-off handoff carries the full setup cost and returns one instance of saving. This is why step one of the build shortlists only recurring tasks. If you find yourself delegating something once, you are asking a favour, which is fine. Just do not count it as delegation.
7. Not naming who owns the output when it goes wrong. With a human delegate this is usually implicit. With an agent it frequently is not, and "the automation did it" is not an accountable answer to a customer or an auditor. Ownership is a field, not a vibe: a named person, a defined scope, an expiry date. We have set out that model for non-human identity in owner, scope and expiry for AI agents.
What This Delegation Matrix Cannot Tell You
Five honest limits, and one of them is structural rather than practical.
We have not tested this framework in a controlled trial. No internal study, no before-and-after measurement across a customer base, no published dataset. The framework is derived from external research on verification cost, vigilance and automation bias, plus the arithmetic of amortised setup. It is a reasoning tool, not an empirical finding, and it should be held to that standard.
Check ratio is a poor instrument for creative and relational work. Verification time only means something when there is a standard of correctness to verify against. For work whose quality is a matter of judgement — brand voice, strategy, difficult conversations — "how long does it take to check" measures how long it takes to form an opinion, which is not the same thing. Use the matrix for work with a right answer and a wrong one.
It says nothing about whether a task should exist. The highest-return move in most task inventories is deletion, and this delegation matrix will cheerfully help you hand over work that nobody needed. Run an elimination pass before you run the matrix.
Failure visibility is binary here and reality is a spectrum. A failure that surfaces in three days is not the same as one that surfaces in three minutes or three quarters, and the binary collapses that. In practice, treat "surfaces after the current cycle closes" as silent and you will be close enough; if your work has meaningful medium-latency failure modes, add a third value.
Some sources a reader would expect are missing. Gartner's own newsroom pages are behind a bot challenge we did not attempt to bypass, so the agentic-project cancellation figure below is cited from industry press reporting the release rather than from Gartner directly. Glassdoor-style aggregated cost benchmarks for delegated task categories were similarly unavailable, so this article contains no salary or rate benchmarks.
The most useful counterargument to everything above: for a human delegate, an early high check ratio is an investment rather than a cost, and a matrix that optimises for cheap verification will systematically under-delegate the developmental work that grows people. That is a real weakness and we would not argue with it. The response is that the matrix should govern sequencing and the first wave, not the whole delegation strategy of a team — and that the developmental case does not transfer to agents, whose check ratio does not fall on its own.
When Delegation Becomes Deployment
At some point the delegation matrix stops being a personal productivity exercise. When the delegate is software, when the same handoff repeats a thousand times a month, and when the outputs touch a general ledger or a customer, the question changes from "what should I hand over" to "who owns this thing, what can it reach, what did it do, and what did it cost". That is the layer LeapForce builds: one controlled place where every AI tool, connector, model and agent is scoped, logged and budgeted, so a delegated task has an owner, an audit trail and a spend limit rather than living in somebody's personal account. Our gateway rollout follows a deliberate order: Observe first. Enforce second. Optimize third. That is the same instinct as quadrant 2 in this matrix, which says to make behaviour visible before you make it autonomous. LeapForce does not decide which tasks belong in your matrix and it is not a virtual assistant; it is the control layer for whatever you have already decided to hand over.
Gartner's June 2025 prediction that more than 40% of agentic AI projects will be cancelled by the end of 2027, citing escalating costs, unclear business value and inadequate risk controls, is the failure mode this article is trying to head off (reported by MarTech). Unclear business value is what you get when nobody measured check time before starting.
Frequently asked questions
No. The Eisenhower matrix sorts tasks by urgency and importance to decide what you do now, schedule, delegate or drop; delegation is one of its four outputs. A delegation framework starts after that decision and asks a different question: of the work that could be handed over, which handoffs will actually save time. The version in this article scores verification cost and failure visibility, neither of which appears anywhere in Eisenhower's grid.
Three categories. Work where you are the accountable party and the accountability is not transferable — regulatory sign-off, people decisions, anything where your name is legally on the outcome. Work whose effective check ratio is at or above 1, where verifying costs more than doing. And work that is the only remaining place you learn something you need to keep knowing, which is Bainbridge's deskilling irony applied to your own job.
Take one real instance of the task that somebody else produced, and time yourself verifying it to the standard you would accept before it goes out. Not skimming, confirming. Do this for three tasks in an hour and you have enough to sort a shortlist. The number only needs to be good enough to place the task above or below 0.45, and estimates are wrong by much more than that.
At or below 0.30, hand it over without further debate. Between 0.31 and 0.45 it is still worth delegating but watch the upkeep line. Between 0.46 and 0.99 delegate only the separable parts of the task. At 1.00 and above, stop: verification costs more than performing the work, and no amount of disliking the task changes that arithmetic.
Yes, and it is arguably more useful there, because your delegate options are software and contractors rather than staff, and both charge you setup cost up front. Run the same six steps. The difference is that the payback table does more work than the quadrant grid: with no salaried delegate absorbing the learning curve, a task with a twenty-hour setup and a two-hour monthly saving is a bad trade you would have made on instinct.
Re-time the check column on delegated tasks after four weeks, then quarterly. Redraw the whole delegation matrix when something structural changes: a new tool with different failure modes, a reorganisation, a new compliance obligation, or a model upgrade. Quarterly is a floor rather than a ritual — the trigger is a change in what verification costs, and that can happen in a week.
Look at how the check ratio behaves over time. A person's falls as they learn, so a high starting ratio is an investment. An agent's stays flat until someone changes the specification, the tools or the model, so a high starting ratio is a permanent tax. When delegating tasks to AI, prefer work that is high-frequency, has a checkable right answer, and comes with a nameable mechanism that catches a bad output. Delegate to a person when judgement, relationships or accountability are the substance of the work.
Payback is setup hours divided by net monthly hours saved, where net is the gross saving minus ongoing upkeep. In the worked example in this article, a scheduling handoff with six hours of setup and 3.6 net hours a month pays back in 1.7 months, while a board-metrics pull with fourteen hours of setup and 1.3 net hours a month takes 10.8 months and will likely break first. Compute this before you start, not after.
A named human, always: the alternative is an accountability gap that no regulator or customer accepts. In practice that means every agent carries an owner, a defined scope of what it may touch, and an expiry date, in the same way a contractor account does. The EU AI Act's Article 14 makes the same point from the oversight side: the people assigned to oversee a high-risk system must be able to interpret, override and stop it.
Usually because the verification cost was never scored, so the saving that justified the pilot is consumed by review work that nobody budgeted. Gartner predicts more than 40% of agentic AI projects will be cancelled by the end of 2027, citing escalating costs, unclear business value and inadequate risk controls. The second common cause is scoring the check ratio on a careful first instance and never re-timing it once the delegate hits the edge cases.
You can delegate decisions, and the matrix handles them the same way — but the failure-visibility axis usually pushes decisions toward quadrant 2 or 4, because a wrong decision rarely trips anything automatically. If you want to delegate a decision, first make it checkable: define the criteria, require the reasoning to be recorded against them, and set a threshold above which the decision escalates. A decision with written criteria is a task with a right answer.
Then delegating that task in its current shape costs you time rather than saving it, and you should stop. Two legitimate exits: redesign the task so it becomes checkable, objective criteria, required citations, structured output, or accept that you are buying relief rather than hours, and say so out loud so nobody counts it as a productivity gain. The third exit, delegating anyway and skipping the verification, is how silent failures compound.
Ready to Govern Your AI?
Talk to LeapForce, one controlled layer for every AI tool, connector, model, and agent.
Comments