
AI sales forecasting produces a number, and then a human changes it. The changed number is what goes to the board. Everything that matters about governing an AI forecast lives in that gap: who may move the model's output, by how much, on what stated reason, and whether the move is still legible a year later.
Our position, and the reason this article exists rather than another nine-step implementation guide, is that the forecasting model is the least interesting part of an AI sales forecasting programme. The model is the part that gets validated. The adjustment on top of it is the part this article is about. A data scientist working on grocery sales forecasts described the modelling reality plainly on Hacker News in November 2022: even for short horizons, "accuracy is surprisingly low, even with lots of data and the most up-to-date forecasting methods", applied by capable people. If that is the floor, then the question worth engineering around is not how to raise accuracy by three points. It is what happens to the number between the model and the boardroom.
The short answer: Treat the delta between the model's forecast and the number your company submits as the governed object. Log every adjustment with an author, an amount, a stated reason and a destination, because the moment that number leaves the sales organisation it stops being an estimate and becomes a commitment somebody has to defend.
Last updated: July 31, 2026.
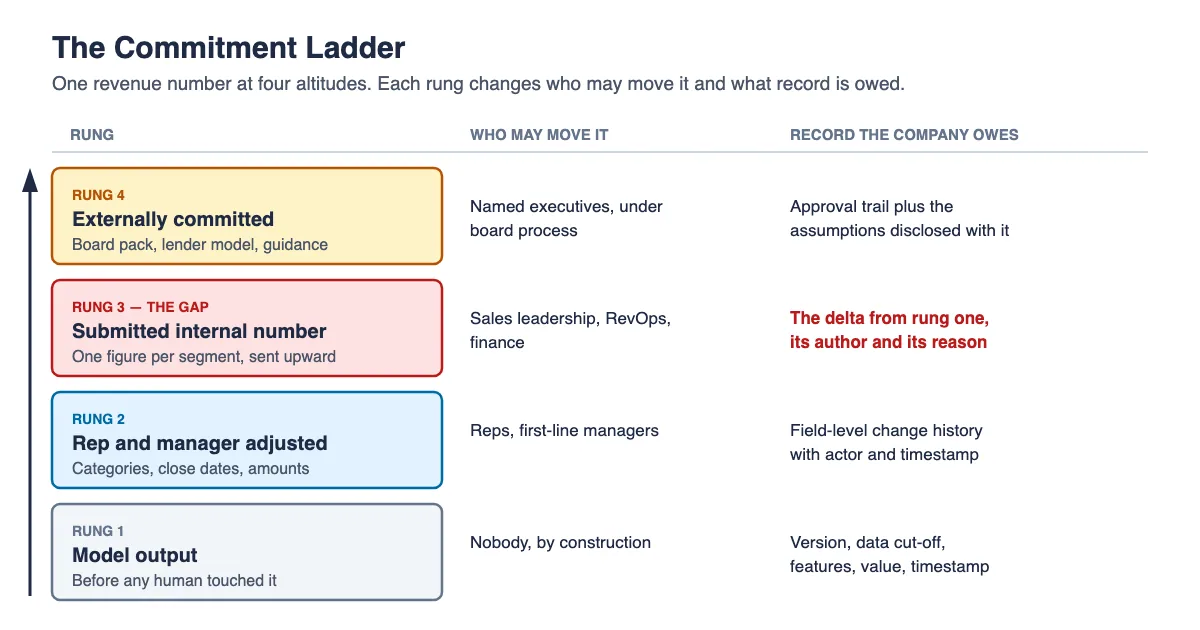
Each rung changes who owns the number and what record the company owes for it.
What AI Sales Forecasting Is, and What It Is Not
AI sales forecasting is the use of statistical or machine-learning models over CRM history, activity data and deal attributes to estimate future bookings or revenue, at a deal level, a segment level or a company level, without a human weighting each opportunity by hand. The output is a distribution or a point estimate with a horizon attached. That is the whole of it.
It is not a decision. A weighted pipeline number produced by a gradient-boosted model and a weighted pipeline number produced by a spreadsheet formula have identical standing until somebody submits one of them. This distinction sounds pedantic and it is the single most useful thing in this article, because the control failures in forecasting happen at the submission step while the vendor conversation happens at the model step.
It is also not a replacement for the pipeline review. Sales teams frequently discover that the model and the review meeting disagree, and treat the disagreement as a defect to be engineered away. The disagreement is the most valuable output either process produces. A model that never disagrees with the reps has learned the reps' optimism; a review that never disagrees with the model has stopped adding judgement and can be turned off.
Three things it is routinely confused with, and how they differ:
| Confused with | What it actually is | Why the distinction matters |
|---|---|---|
| Revenue intelligence | Conversation and activity capture that produces features | Feeds a forecast; is not one |
| Lead or deal scoring | A per-record propensity used to prioritise work | Allocates attention, not a company number |
| Financial planning | Budget and target setting, a normative exercise | A target is what you want; a forecast is what you expect |
That last row is where a forecasting process quietly breaks. Bend a forecast toward the target and it has stopped being a forecast, and no model can detect that it happened, because the bending occurs after the model has run.
We should be direct about our own standing here. LeapForce builds the deployment and governance layer for enterprise AI; we do not sell a revenue forecasting product and we have not run a deal-level forecasting model on our own pipeline at the scale this article discusses. Nothing below is a report of our own model's performance. The mechanisms come from published research, primary regulatory text and the governance patterns we do operate, and where we would normally hand you a measured number from our own run, we have given you a procedure instead.
The Commitment Ladder: Four Rungs a Revenue Number Climbs
A revenue forecast is not one number. It is the same number at four different altitudes, and at each rung it acquires a new owner, a new set of hands that can move it, and a different obligation to keep a record. We call this the Commitment Ladder, and the point of naming it is that most forecasting arguments are really arguments about which rung the speaker is standing on.
Rung one: the model output. Whatever the algorithm produced, before any human touched it. This number has a timestamp, a data cut-off, a model version and a set of input features. It is the only rung that can be reproduced mechanically, and it is the rung a forecasting stack is least likely to persist.
Rung two: the rep and manager adjustment. Deals get moved between commit, best case and pipeline categories. Close dates shift. Amounts change. Deals the model never saw get added because they were created after the data cut-off. This rung is high-volume, low-value-per-change, and it is where the CRM's own audit trail is at least nominally supposed to help.
Rung three: the submitted internal number. One figure per segment goes into the forecast call and up the management chain. This is the first rung where the number stops being a collection of opinions about deals and becomes a single claim by an organisation about itself. It usually differs from the sum of rung two, and the difference usually has no per-deal explanation.
Rung four: the externally committed number. The board pack. The lender covenant model. The investor update. For a public company, the guidance range in the earnings release. At this rung the number leaves the building, and the set of people who may change it collapses to a very small group whose names appear on other documents.
| Rung | The number is | Who can move it | Record the company owes |
|---|---|---|---|
| 1. Model output | An estimate | Nobody, by construction | Version, data cut-off, features, value |
| 2. Rep and manager adjustment | An opinion about deals | Reps, first-line managers | Field-level change history with actor and time |
| 3. Submitted internal number | A claim by the organisation | Sales leadership, RevOps, finance | The delta from rung one, its author and its reason |
| 4. Externally committed number | A commitment | Named executives, subject to board process | Approval trail plus the assumptions disclosed with it |
The governance failure this article is about is a rung-three failure. Rung one is instrumented because engineers built it. Rung two is instrumented because CRMs ship field history. Rung four is instrumented because lawyers and auditors are watching. Rung three sits between an engineering artifact and a legal artifact, is owned by neither function, and is where the number actually changes most.
Two consequences follow immediately. First, when someone asks "how accurate is our AI forecast", the answer depends entirely on which rung you measure, and comparing rung-one accuracy against rung-four outcomes is a reliable way to flatter your own model. Second, an adjustment that is invisible at rung three does not become visible again higher up. The board sees a number and, at best, a variance commentary written by the same person who made the adjustment.
The Override Is the Governance Object, Not the Model
If you can only instrument one thing in a revenue forecasting programme, instrument the difference between the model's number and the number you submit. Not the model's accuracy. Not the feature importances. The delta, with an author attached to it.
The reason is structural. A model's errors are, in the ordinary case, unbiased in intent: they come from the data, the horizon and the algorithm, and they are as likely to be embarrassing in one direction as the other. An override is authored. It carries the incentives of whoever authored it, and in a sales organisation those incentives are not symmetric. A rep who sandbags is protecting a bonus threshold. A manager who pulls a number up is protecting a promise made in the last forecast call. A CRO closing the gap to the board number is doing something everyone understands and nobody writes down.
Six attributes make an override reconstructable. Anything less and you have a number without an argument behind it:
| Attribute | What it records | Failure if missing |
|---|---|---|
| Author | The named person, not the team | "Sales adjusted it" names nobody |
| Amount | The signed delta, in currency | A restated total hides the size of the move |
| Basis | Which deals or segments it applies to | Unattributable adjustments cannot be evaluated |
| Reason | Free text, written at the time | Reasons reconstructed later are rationalisations |
| Destination | Which rung the adjusted number went to | An internal tweak and a guidance input differ in kind |
| Model reference | Version and run identifier it adjusts | Without it the delta has no anchor |
The destination row is the one that separates this problem from ordinary internal analytics. An adjustment that stays inside a sales team is a management matter. The identical adjustment, if the adjusted number is what feeds a range published to investors, sits inside a control environment with statutory shape. Same act, same person, same spreadsheet cell, entirely different obligations. Go and check whether any field in your own stack records which of the two it was.
There is a cheap version of this that needs no purchase: freeze the model output to an immutable store the moment it runs, require that every subsequent change to the submitted figure be entered as a delta rather than a replacement, and make the reason field mandatory and non-empty. That is not a platform. It is a discipline about how numbers are stored, and it is the difference between having an argument and having a total.
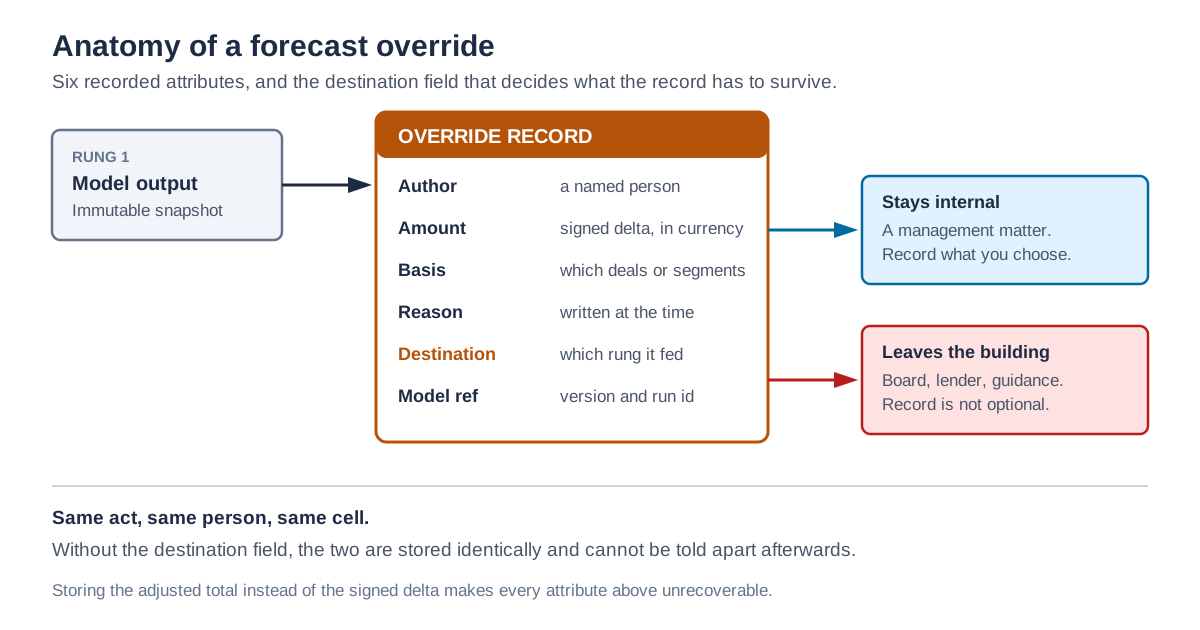
An override without an author, a basis and a destination is a number that no one can defend later.
What the Research Actually Says About Judgmental Adjustments
The published evidence on humans adjusting statistical forecasts is substantial, decades old, and almost entirely absent from AI sales forecasting vendor material. It does not say that human adjustment is bad. It says something more useful and more uncomfortable: adjustments are near-universal, they skew upward, and the ones that damage accuracy are followed by more of the same.
Petropoulos, Fildes and Goodwin, writing in the European Journal of Operational Research, note that judgmental interventions on statistical forecasts are so routine that Fildes and colleagues reported in 2009 that "91% of the forecasts examined in one organisation were subject to judgmental adjustments". Not 91 per cent of exceptional cases. Ninety-one per cent of forecasts. Any control design that treats the override as an edge case is designing for a world that does not exist.
The same paper analyses a large multinational data set of pharmaceutical demand forecasts, expert adjustments and actual sales, and reports that "overall 57.8% of the adjustments to the statistical forecasts were in the upwards direction". That is a modest skew rather than a dramatic one, and the paper's own sentence goes on to note that forecasts were frequently lowered too; the point is that the distribution is not centred. Its central finding concerns what the authors call big losses, meaning an adjustment that significantly worsens accuracy relative to the untouched statistical forecast. They find that big losses "are observed more frequently after positive adjustments", and and that after one, experts are more likely to make "large judgmental adjustments in the opposite direction to the previous large error", which in turn is more likely to produce another big loss.
That is a demand-planning data set in pharmaceuticals, not a B2B sales pipeline, and we are not going to pretend the percentages transfer. What transfers is the shape of the phenomenon and one mechanism the authors name explicitly among the reasons planners adjust: that planners may change statistical forecasts to stay "in-line with budgeting or politically-related targets set by senior managers". A sales organisation has that pressure in a purer form than a demand planner does, because the target and the forecast are discussed in the same meeting by the same people.
Three design implications fall out of this literature and they are all cheap:
- Log the adjustment, not the adjusted total. If the system stores only the final figure, the direction and magnitude of human intervention are permanently unrecoverable, and the entire body of research above becomes inapplicable to your own data.
- Report adjustment direction as a standing metric. A quarterly count of upward versus downward overrides, by author, is a two-line query once deltas are stored. It is also the single most confronting number you can put in front of a forecast committee.
- Score adjustments against the untouched model. Every quarter, compare the actual result against both rung one and rung three. If the overrides are not beating the raw model over a year, they are ceremony with a cost.
The third one has a defensive property worth naming: it is very hard to argue with, because it requires no view about whether any individual override was justified. It only asks one thing: did the aggregate of judgement, over four quarters, move the number closer to reality.
Which Rulebook Applies Depends on Where the Number Lands
A forecast that never leaves the sales organisation is a management artifact. The same forecast, once it becomes an input to something a public company files or furnishes, sits inside a control regime defined by rule, and the first question to settle is which of the two yours is. This section is about the settled text, not about resolving anything contested.
Two definitions do most of the work, and they are frequently conflated. Under the SEC's rule on controls and procedures, 17 CFR 240.13a-15, the term "disclosure controls and procedures" means:
controls and other procedures of an issuer that are designed to ensure that information required to be disclosed by the issuer in the reports that it files or submits under the Act ... is recorded, processed, summarized and reported, within the time periods specified in the Commission's rules and forms.
The same rule defines "internal control over financial reporting" separately and much more narrowly, as a process:
to provide reasonable assurance regarding the reliability of financial reporting and the preparation of financial statements for external purposes in accordance with generally accepted accounting principles.
Read those two side by side and the practical consequence is clear enough to act on. A forward-looking revenue projection is not a financial statement prepared under generally accepted accounting principles, so a sales forecast is not automatically inside internal control over financial reporting simply by existing. Where it becomes information an issuer has to accumulate and communicate to management for timely disclosure decisions, disclosure controls are the regime that is engaged. And where the same forward-looking estimate feeds an accounting measurement, whether a variable-consideration estimate, an impairment test or a credit-loss allowance, it is inside the financial-reporting perimeter through that door, as an accounting estimate.
| Where the number lands | Regime most directly engaged | Practical record obligation |
|---|---|---|
| Sales team only | None external | Whatever management chooses |
| Board pack, private company | Governance, not securities rules | Board minutes and the pack itself |
| Public-company guidance | Disclosure controls and procedures | Accumulation and communication to management |
| An accounting measurement | Accounting-estimate requirements | Methods, data and significant assumptions |
The federal safe harbour for forward-looking statements is the other piece of settled text worth reading in the original, because of what it says about approval. Under 15 U.S.C. 78u-5, a forward-looking statement includes "a statement containing a projection of revenues" and, notably, "any statement of the assumptions underlying or relating to" such a projection. The safe harbour applies where the statement is:
identified as a forward-looking statement, and is accompanied by meaningful cautionary statements identifying important factors that could cause actual results to differ materially from those in the forward-looking statement
and, on the alternative branch, where a plaintiff fails to prove that a statement by a business entity was "made by or with the approval of an executive officer of that entity" and "made or approved by such officer with actual knowledge by that officer that the statement was false or misleading."
Two observations that stay strictly on the face of the text. First, the statute contemplates a specific approving executive officer, which is a governance concept rather than a modelling one — someone approves, and that someone is identifiable. Second, the assumptions behind a projection are themselves within the definition of a forward-looking statement, so how a company describes the basis of its forecast is part of what the framework covers.
What we are deliberately not doing here. We are not telling you whether a machine-learning model in the forecasting chain changes the availability of the safe harbour, whether a specific override needs to be disclosed, or whether your forecasting process is or is not part of your internal controls. We could not find published enforcement or case law addressing an AI-generated forecast input specifically, and constructing an answer from the statutory text would be exactly the sort of confident novel reading that a securities lawyer would take apart. Those are questions for your own counsel and your auditor, with your specific facts. Non-public companies have no securities-law obligation here at all, which changes the legal picture entirely and changes the governance picture not very much, because a board that was given a number still asked for it in good faith.
What is not contested, and what this article does assert: if a number left your building, somebody should be able to say who produced it, who changed it, and on what stated basis, without reconstructing it from memory.
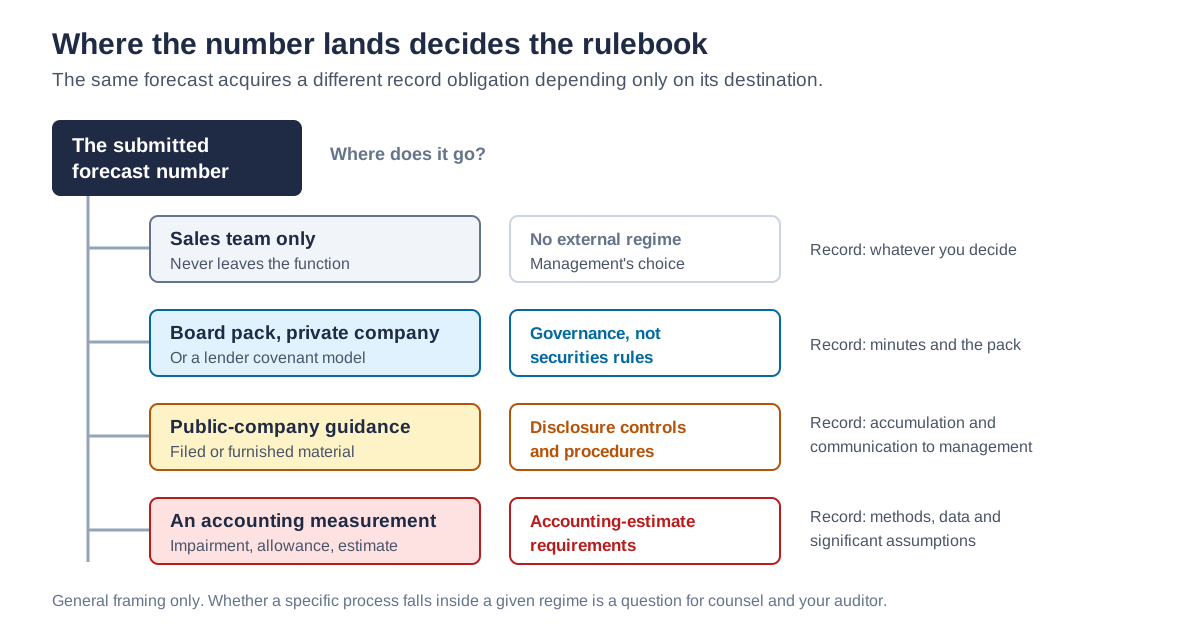
The same forecast acquires different obligations depending only on where it is sent.
What Auditors Already Ask About an Estimate
Where a forward-looking figure does feed an accounting measurement, there is an existing professional standard describing what gets tested, and it is more specific than most revenue teams expect. Reading it is the cheapest way to find out what your forecasting process will be asked for, because the questions do not change when the estimate happens to come from a model.
The Public Company Accounting Oversight Board's standard on auditing accounting estimates, AS 2501, frames the work as testing the company's process, which "involves performing procedures to test and evaluate the methods, data, and significant assumptions used in developing the estimate." Methods, data, assumptions. A model is a method. Its training set and features are data. Its hyperparameters, horizon and segment definitions are assumptions. None of those categories is new, and all three are expected to be describable.
Two clauses in that standard land directly on how AI forecasting programmes actually behave. The first concerns changing the approach:
If the company has changed the method for determining the accounting estimate, the auditor should determine the reasons for such change and evaluate the appropriateness of the change.
Model teams retrain, re-specify and swap architectures as a matter of routine engineering hygiene, and rarely record a business reason for doing so, because within the modelling frame there is no business reason — there is a validation score. The second clause is sharper still:
In circumstances where the company has determined that different methods result in significantly different estimates, the auditor should obtain an understanding of the reasons for the method selected by the company and evaluate the appropriateness of the selection.
A company running both a model forecast and a judgement-adjusted forecast has, by definition, two methods producing different estimates. It has chosen one. The reason for that choice is precisely what the override log records, and precisely what nobody writes down.
The broader auditing standard on evaluating results, AS 2810, requires an auditor to "evaluate the qualitative aspects of the company's accounting practices, including potential bias in management's judgments," and gives selective correction of misstatements as an example form of that bias. The pattern it describes — errors corrected in one direction and left in the other — has an obvious analogue in a forecast where downward adjustments get scrutiny and upward ones do not.
None of this is AI-specific, which is the point. The bar an AI sales forecast is measured against, wherever it touches financial reporting, is an existing bar for estimates, applied to an estimate that now arrives faster and with more apparent authority than the one it replaced.
Run the Rung Test in One Sitting
This is the diagnostic, and it is deliberately small. Two hours, four people: whoever owns the model or the forecasting tool, whoever assembles the submitted number, whoever presents it upward, and one first-line sales manager who does rung-two adjustments every week. The last person is not optional: they know about adjustments the other three have forgotten they make.
Step 1. Write down the four rungs with names in them. Not roles. Names. For each rung, the individual who last changed the number in the most recent closed quarter. If a rung has no name, you have found your answer for that rung already.
Step 2. Ask for last quarter's rung-one number. The raw model output, as of the date the forecast was submitted. Do not accept a re-run. If the only way to produce it is to run the model again against today's data, note that and move on; the next section is about why that matters.
Step 3. Compute the delta to the submitted number. One subtraction. Express it as a currency amount and as a percentage of the model output. This single figure is the most informative number in the exercise. Calculate it before the meeting ends, and note whether anyone in the room had seen it before.
Step 4. Try to decompose the delta. How much of it can be attributed to specific deals or specific segments, and how much is a lump adjustment with no basis? Record the unattributable share as a percentage. That share is your governance gap, quantified.
Step 5. Find the reason text. For each adjustment you can identify, was a reason recorded at the time, in a system, by the person who made it? Reasons supplied during the exercise itself do not count and should be marked as reconstructed.
Step 6. Trace the destination of each version. Which rung's number appeared in the board pack? In the QBR deck? In any external material? This is where an organisation sometimes discovers that different rungs went to different audiences in the same week.
Step 7. Ask who could have changed rung four and did not. Authority that exists but was not exercised still needs to be written down. An unbounded ability to move the committed number is a control weakness whether or not anyone used it.
Step 8. Write one page and stop. Four rungs, four names, one delta, one unattributable percentage, one list of destinations. Resist expanding this into a project. The page is the deliverable, and it is reviewable by someone who was not in the room, which is the only property that matters.
We call this the Rung Test, and the artifact it produces the override log once it is running continuously. The name is worth having because it gives people a way to ask a precise question — "which rung is that number?" — in a meeting where the alternative is a vague argument about whether the forecast is any good.
Worked Example: One Quarter's Override Log
Here is a completed override log for a hypothetical mid-market B2B SaaS company: roughly 400 opportunities in a quarter, a deal-level machine-learning forecast refreshed weekly, and a $12.0M quarterly target. It is illustrative, constructed to show what the artifact looks like when it is finished, and it is not a client engagement. We say so plainly because a fabricated case study dressed as a real one is worth less than nothing.
The rung-one model output, at the week-12 data cut-off, was $10.85M. Ten adjustments were applied before submission.
| # | Adjustment | Author | Basis | Delta | Reason recorded at the time |
|---|---|---|---|---|---|
| 1 | Acme renewal moved to certain | Deal desk | One deal, $900k at 62% | +$342k | Yes — contract counter-signed |
| 2 | Northwind expansion removed | Rep | One deal, $400k at 45% | −$180k | Yes — champion departed |
| 3 | New EMEA logo added | Rep | One deal, $300k at 40% | +$120k | Yes — created after data cut-off |
| 4 | Duplicate renewal record removed | RevOps | Two opportunity records | −$95k | Yes — data defect ticket |
| 5 | Quarter-end pull-forward | VP Sales | 14 deals, unspecified | +$260k | No |
| 6 | Slippage haircut on inbound segment | Finance | Segment-wide, no deals named | −$150k | Partial — "historical slippage" |
| 7 | Adjustment to reach commit | CRO | None stated | +$410k | No — field read "commit" |
| 8 | FX revaluation, two EMEA deals | Finance | Two deals | −$60k | Yes — rate as at cut-off |
| 9 | Services attach not modelled | RevOps | Six named services attachments | +$75k | Yes — model scope excludes services |
| 10 | One deal reclassified non-recurring | RevOps | One deal | −$40k | Yes — ARR definition |
Net adjustment: +$682k. Submitted rung-three number: $11.53M. The board pack showed $11.5M against a $12.0M target, described as a manageable gap.
The quarter closed at $10.90M.
Now read the log rather than the outcome, because the outcome is the least interesting part.
The raw model was closer than the submitted number. Rung one missed by $50k, about half a per cent. Rung three missed by $630k, about 5.8 per cent. One quarter proves nothing — the sign could easily reverse next quarter — but nobody would know either way, because if rung one was never persisted the comparison cannot be run at all.
Three rows carry $520k of the $682k net movement and no per-deal basis. Rows 5, 6 and 7 net to +$520k, which is 76 per cent of the total net adjustment, and none of them can be attributed to a deal a person could name. The seven rows that do have a basis net to +$162k. The governance problem is not that judgement was applied; it is that three-quarters of the applied judgement is unattributable and two of those three rows have no reason text.
The direction asymmetry is visible in one glance. Five upward adjustments total +$1,207k. Five downward adjustments total −$525k. Equal counts, and the upward moves are 2.3 times the magnitude. That is the shape the forecasting literature describes, showing up in a single quarter of one company's log, and it is invisible unless deltas are stored rather than totals.
Row 7 is the one that would hurt. An adjustment authored by a named executive, with no basis and a reason field containing the word "commit", sitting in the chain that produced the number shown to the board. Nothing about it is unusual and nothing about it is illegitimate. It is simply undocumented, and undocumented is the state in which an ordinary management decision becomes hard to explain nine months later.
The remediation for this log is not nine fixes. It is two: make the reason field mandatory for any adjustment above a stated threshold, and require a basis for any adjustment above a stated percentage of the model output. Rows 1 through 4 and 8 through 10 were already fine.
Could You Reproduce Last Quarter's Forecast Today?
Re-running the model is not reproduction. This is the test that separates a forecasting process with a memory from one without, and it fails quietly, which is why it surfaces only when somebody asks a question about the past.
A forecast produced in March and re-run in November will differ even if nobody touched the code, for reasons that are all ordinary:
- The CRM has been overwritten. Close dates, amounts and stages are mutable fields. A pipeline snapshot taken today describes today's beliefs about the past, not March's.
- The model has been retrained. Weights differ. So does the score for an identical input row.
- The feature pipeline has changed. A new field was added, a join was fixed, a segment definition was tightened.
- Late-arriving data has settled. Records that were incomplete in March are complete now, and deal slippage that was undecided then has resolved, which improves the re-run and makes it a worse reconstruction.
Every one of those makes today's re-run more accurate and less true. What you need is a snapshot, not a recomputation, and the difference is a design decision taken once, at low cost, or not at all.
| Artifact | Reconstructable later if not stored? | What it is needed for |
|---|---|---|
| Rung-one value and timestamp | No — the model has moved on | The anchor for every delta |
| Model version and training window | No — unless written at the time | Establishing what produced the estimate |
| Input feature values as scored | No — the source fields are mutable | Explaining a specific deal's weighting |
| Rung-two and rung-three deltas with author | No — only the total survives | The whole of this article |
| Which number went to which audience | Partly — from decks and minutes | Knowing what was actually committed |
Two practical notes. Write the model version identifier next to every persisted forecast at write time; it costs nothing then and is close to unrecoverable later. And set the retention window from the commercial and reporting exposure rather than from data-engineering convenience. If a board can reasonably ask about a number twelve months on, twelve months is the floor. A ninety-day rolling window is not a policy. It is a default nobody chose.
This is a records problem before it is a modelling problem, and it is the same class of problem we described for agent actions in our earlier analysis of AI observability and audit trails, and for data provenance in our work on pipeline lineage. The useful record is the one capturing the decision context, not just the output.
Accuracy Is the Wrong First Question; Bias Is the Right One
A forecast that is wrong by six per cent in a random direction each quarter is a working forecast. A forecast that is wrong by three per cent in the same direction every quarter is a broken one, and standard accuracy measures rate the second one higher. It is an easy measurement error to make and an entirely avoidable one.
The forecast accuracy metrics in common use make this easy to miss. Mean absolute percentage error and its symmetric variant collapse direction. They tell you the average size of the miss, which is what a modeller wants to minimise, and they discard exactly the information a governance reader needs: whether the organisation is systematically optimistic. Forecast bias — the signed mean error over a run of periods — is the metric that answers the question the board is actually asking, and it is the one to look for first on your own dashboard.
The distinction has a practical consequence for the override discussion above. A persistent positive bias at rung three, against an unbiased rung one, is direct evidence that the adjustment layer rather than the model is the source of the error. Without both rungs stored, that diagnosis is unavailable and the conversation defaults to blaming the model, which is the party in the room with no advocate.
| Metric | What it answers | What it hides | Use it for |
|---|---|---|---|
| MAPE | How big is the average miss | The direction of the miss | Model selection |
| sMAPE | Same, less skewed on small actuals | Same | Model comparison |
| Forecast bias | Are we systematically over or under | The size of individual errors | Governance review |
| Hit rate within a band | How often are we usefully close | Everything about the tails | Operational planning |
| Delta from rung one | How much did judgement move it | Whether judgement helped | The override review |
On the accuracy benchmarks you will find quoted. Searching for AI sales forecasting accuracy figures returns a consistent set of impressive numbers — specific percentage improvements over manual forecasting, error bands for well-run AI programmes, shares of organisations achieving some threshold. We could not trace any of them to a published methodology with a described sample. They appear in vendor and directory content citing each other, and the analyst reports occasionally named as the origin sit behind paywalls we did not clear. Reddit's revenue-operations communities, where practitioners discuss their real quarterly variance most candidly, were not reachable through our fetch ladder on the day of writing. Rather than launder a second-hand figure through this article, we have quoted none of them, and the honest position is that your own historical variance is the only benchmark that bears on your decision anyway.
That is not a rhetorical dodge, and it comes with an instruction. Compute your own forecast accuracy and signed bias over the last eight closed quarters before you evaluate any product. It takes an afternoon, it is the number every vendor demonstration will implicitly claim to improve, and without it you cannot tell whether a proposal is worth anything.
Seven Ways an AI Sales Forecast Goes Wrong in the First Quarter
Ordered roughly by how expensive they are and how long they stay invisible.
The model is scored against the adjusted number. Somebody evaluates model quality by comparing its output to the submitted forecast rather than to the actual result, on the reasonable-sounding basis that the submitted forecast represents the organisation's best knowledge. It represents the organisation's judgement, including its optimism, and a model tuned to reproduce it has been trained to be optimistic.
The training labels encode a definition nobody checked. Bookings, billings, recognised revenue, net new ARR and gross new ARR are different quantities. The model learned one of them from a CRM field. The board is asking about another. Nothing in the output announces the mismatch, and the gap can persist for a year.
Deal-stage features make the model a mirror. If stage progression is a strong feature and stage is set by the rep, the model is largely predicting rep sentiment with extra steps, and the same is true of any feature built from stage-derived quantities such as pipeline coverage or a stage-weighted win rate. It will look accurate in backtest because rep sentiment does correlate with outcomes, and it will fail in exactly the quarter when rep sentiment is wrong, which is the quarter you needed it.
Nobody defined the horizon. In-quarter forecasting, next-quarter forecasting and annual planning are three different problems with different feature sets and different error tolerances. One model asked to serve all three will serve none well, and its accuracy will be reported as a single number that describes none of the three.
The forecast becomes a target. Once a model's output is used to set quota or to judge a manager, the inputs it depends on are under pressure. CRM fields are the inputs. This is the most predictable failure in the list and the least frequently designed against, and it belongs to the same family of problems as a predictive score turning into a spending decision, which our earlier analysis of AI in customer success sets out in full.
Agents get write access to the fields the forecast reads. An assistant that updates close dates and amounts is editing an input to a number that goes to a board. Our analysis of sales process automation treats this at length; the short version is that write access to forecast-bearing fields is a different risk class from write access to activity logs, and tooling that treats every CRM write alike will not distinguish them.
Rollout to the whole company at once. There is no reason to. Run the model in observe mode against one segment for a quarter, store both rungs, and compare. This is the sequencing our own AI gateway rollout guidance prescribes: observe first, enforce second, optimize third. It applies to any model whose output will eventually be committed to.
When the Spreadsheet Roll-Up Still Wins
Below roughly a few hundred closed opportunities per year, or with fewer than about eight quarters of consistent CRM history, a weighted pipeline roll-up maintained by a person is usually the better instrument, and the reason is not that machine learning fails at small n. It is that a roll-up is legible. Every weight in it can be argued with by name in a meeting, which means errors surface as disagreements rather than as variance.
There are three other conditions where the manual number is the honest choice. A business that has just changed its pricing model, its segment focus or its sales motion has broken the correspondence between its history and its future, A model trained on the old motion will be confidently wrong in a way a person who lived through the change will not. A business with very few, very large deals has a forecast that is dominated by idiosyncratic facts about four accounts, and no amount of data helps. And a business whose CRM hygiene is genuinely poor is better served by fixing that first, because a model over bad fields industrialises the badness rather than revealing it. Our analysis of the quote-to-cash process makes the same point about the record chain more generally.
The hybrid that works, and it is unglamorous: run the model as a second opinion for a full year with both rungs stored, submit the human number, and review the two against actuals every quarter. If the model wins consistently over four quarters, switch the default and keep the human as the override with the discipline described above. If it does not, you have learned something for the price of a storage bucket.
Where This Analysis Is Still Uncertain
Stated plainly, because the alternative is borrowing confidence from adjacent findings.
- We have not operated a deal-level sales forecasting model. LeapForce builds the governance and deployment layer for enterprise AI, not a revenue forecasting product. Every mechanism above is derived from published research, primary regulatory and standards text, and the governance patterns we do run. No number in this article is a measurement of our own forecasting performance, and the worked example is constructed rather than observed.
- The judgmental-adjustment evidence is from demand planning, not B2B sales. The 91 per cent adjustment rate and the 57.8 per cent upward skew come from supply-chain and pharmaceutical data sets. The mechanism — authored adjustments carrying the author's incentives — is general. The magnitudes are not, and we have not found an equivalent published study on B2B sales pipeline overrides.
- The legal boundary is genuinely unsettled at the edges. We could locate no published enforcement action or case law addressing whether a machine-learning model in the forecasting chain changes anything about disclosure controls or safe-harbour availability. We have quoted the operative text and stopped there. Anyone who tells you the answer is clear either has facts we do not or is guessing.
- We could not verify the circulating accuracy benchmarks. Covered above. The result is that this article contains no forecast-accuracy percentage claims of its own, which makes it less quotable and more honest.
- We do not know how large an unattributable adjustment share is normal. The 76 per cent in our worked example is a constructed figure chosen to be illustrative, not an observed norm. We would genuinely like to see published data on this and could not find any. If your own log shows something very different, your log is better evidence than this article.
Where the Governance Layer Fits
The forecast is one number, which is why this looks like a revenue-operations problem for the first year. It stops looking like one when the second and third models arrive. A pricing model influences discount floors. A lead model allocates sales capacity. A churn model shapes the renewal assumption inside the same forecast. Each has its own rung structure. Each has its own adjustment layer with no reason field, and its own quiet path into a number somebody committed to.
That is the layer LeapForce builds: one governed place where AI systems have an owner, a scope, a recorded history of what they produced and what was done with it, and a policy enforced in the request path rather than described in a wiki. Our observability and audit work is aimed at exactly the record problem this article keeps returning to — retaining what a system produced, on what basis, and what a human then changed, in a shape that survives a question asked a year later. Non-human identities are first-class in our access and identity model, so an automation that writes to forecast-bearing fields has an owner, a scope and an expiry in the same way a person does.
To be direct about the limit: LeapForce does not build sales forecasting models, and a governance layer will not make your forecast more accurate. What it changes is whether the number's history is reconstructable and whether the people who moved it are named. That is the half of the problem no forecasting vendor will solve for you, because it is not a forecasting problem.
Frequently asked questions
AI sales forecasting is the use of statistical or machine-learning models over CRM history, deal attributes and activity data to estimate future bookings or revenue without a human weighting each opportunity by hand. The output is a point estimate or a distribution with a horizon and a data cut-off attached. It differs from a weighted pipeline spreadsheet in how the weights are derived, not in what the number means, and it has no more standing than the spreadsheet until somebody submits it as the organisation's forecast.
There is no transferable number, and the percentages circulating in vendor content could not be traced to a published methodology with a described sample, so this article quotes none of them. The honest answer is that accuracy depends on your deal count, your sales-cycle length, your horizon and your CRM hygiene, and that your own historical variance over the last eight closed quarters is the only benchmark that bears on your decision. Compute your own signed bias alongside your average error before evaluating any vendor, because a systematically optimistic forecast can score well on error size while being useless.
Yes, and the research supports it — judgmental adjustment is near-universal and is not inherently harmful. What matters is that the override is recorded as a signed delta with a named author, a basis in specific deals or segments, and a reason written at the time rather than reconstructed later. Petropoulos, Fildes and Goodwin's analysis of a large pharmaceutical demand data set found 57.8 per cent of adjustments were upward and that accuracy-damaging adjustments occur more frequently after positive ones, which is a reason to measure the override layer rather than a reason to forbid it.
It depends on where the number goes, and the answer is not one a blog post should settle for you. The SEC's rule at 17 CFR 240.13a-15 defines internal control over financial reporting narrowly, around the preparation of financial statements under generally accepted accounting principles, and defines disclosure controls and procedures separately and more broadly around information an issuer must disclose. A forward-looking projection is not a financial statement, so a sales forecast is not automatically inside internal control over financial reporting; where the same estimate feeds an accounting measurement, it enters as an accounting estimate. Put your specific facts to your counsel and your auditor rather than to a general framing.
Six fields, and all six are cheap: the named author, the signed delta in currency, the basis in specific deals or segments, a reason entered at the time, the destination the adjusted number went to, and the model version and run identifier the adjustment applies to. The destination field is the one teams omit and the one that later matters most, because an adjustment that stayed inside a sales team and an adjustment that fed a number published externally are different acts recorded identically.
Set the window from the period over which someone can reasonably ask about the number, not from storage convenience. If a board, a lender or an auditor can raise a question about a quarter twelve months after it closed, twelve months of forecast snapshots, model versions and override logs is the floor. A ninety-day rolling window is a default, not a policy. Retention obligations that attach through securities or accounting rules are a matter for your counsel and your auditor, and they are separate from the operational floor described here.
Start by matching the method to the shape of your pipeline rather than to what is fashionable. Time-series methods such as exponential smoothing or ARIMA fit repeatable, high-volume revenue with seasonality; deal-level machine-learning models fit pipelines with enough closed opportunities to learn from; a weighted pipeline roll-up fits low-volume, high-value books where four accounts dominate the quarter. Hybrid approaches that run a model as a second opinion alongside a human roll-up are the most defensible starting point, because they generate the comparison evidence you need to decide which one to trust.
Decide the cadence in advance from how fast your business changes rather than from a default, and treat every retrain as an event that needs a recorded reason. Auditing standards on accounting estimates already expect a company that changed its method to be able to give the reasons for the change, and a retrain that shifts the score distribution changes what every downstream threshold means. Snapshot the forecast distribution before and after each retrain, and keep the previous version's outputs so the two can be compared against the same actuals.
One named person per rung, which is the useful reframing. In practice the model has a technical owner, the submitted number has a revenue-operations or finance owner, and the externally committed number has an executive owner whose approval is already contemplated by governance processes. The failure is not shared ownership; it is a rung with no name attached, and the rung most exposed to that is the submitted internal number, sitting between an engineering artifact and a legal one and owned by neither function.
The model is the cheap part. The recurring costs are storing the raw model output as an immutable snapshot rather than only the final figure, retaining feature values and model versions for as long as the number can be questioned, building and maintaining an override path that captures author and reason, and running a quarterly review that scores the adjusted forecast against the untouched one. A programme that budgets for the model and not for those four items will produce a number that is possibly more accurate and definitely harder to explain, which is a poor trade at the moment somebody asks.
Ready to Govern Your AI?
Talk to LeapForce — one controlled layer for every AI tool, connector, model, and agent.
Comments